Honduran vs Immigrants from Ethiopia 1 or more Vehicles in Household
COMPARE
Honduran
Immigrants from Ethiopia
1 or more Vehicles in Household
1 or more Vehicles in Household Comparison
Hondurans
Immigrants from Ethiopia
88.1%
1 OR MORE VEHICLES IN HOUSEHOLD
1.0/ 100
METRIC RATING
253rd/ 347
METRIC RANK
89.6%
1 OR MORE VEHICLES IN HOUSEHOLD
42.5/ 100
METRIC RATING
181st/ 347
METRIC RANK
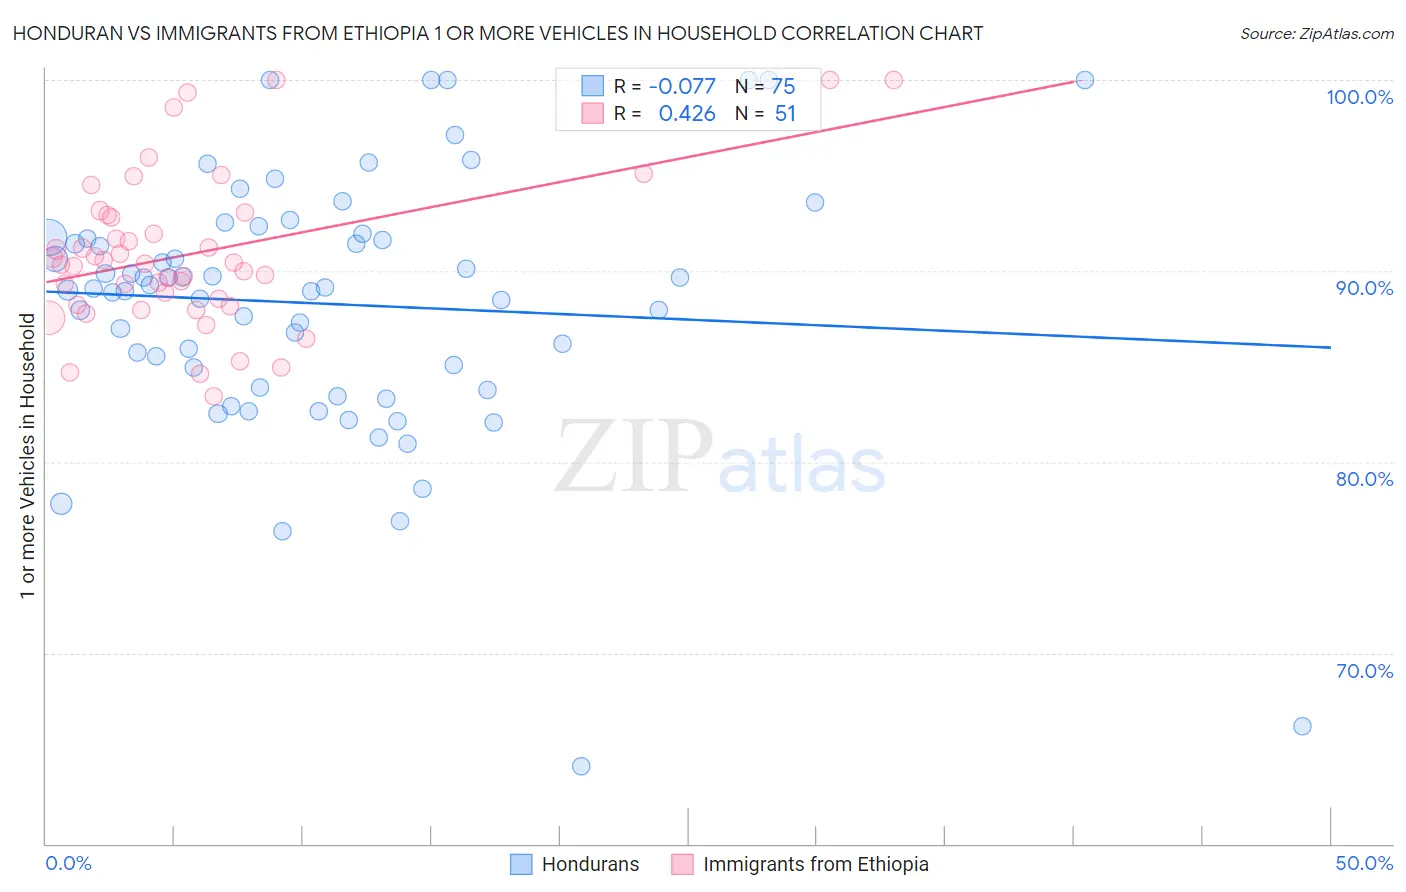
Honduran vs Immigrants from Ethiopia 1 or more Vehicles in Household Correlation Chart
The statistical analysis conducted on geographies consisting of 357,633,161 people shows a slight negative correlation between the proportion of Hondurans and percentage of households with 1 or more vehicles available in the United States with a correlation coefficient (R) of -0.077 and weighted average of 88.1%. Similarly, the statistical analysis conducted on geographies consisting of 211,422,561 people shows a moderate positive correlation between the proportion of Immigrants from Ethiopia and percentage of households with 1 or more vehicles available in the United States with a correlation coefficient (R) of 0.426 and weighted average of 89.6%, a difference of 1.7%.
1 or more Vehicles in Household Correlation Summary
| Measurement | Honduran | Immigrants from Ethiopia |
| Minimum | 64.1% | 83.5% |
| Maximum | 100.0% | 100.0% |
| Range | 35.9% | 16.5% |
| Mean | 88.3% | 90.9% |
| Median | 89.1% | 90.4% |
| Interquartile 25% (IQ1) | 83.9% | 88.2% |
| Interquartile 75% (IQ3) | 91.7% | 92.9% |
| Interquartile Range (IQR) | 7.8% | 4.7% |
| Standard Deviation (Sample) | 6.8% | 4.0% |
| Standard Deviation (Population) | 6.7% | 4.0% |
Similar Demographics by 1 or more Vehicles in Household
Demographics Similar to Hondurans by 1 or more Vehicles in Household
In terms of 1 or more vehicles in household, the demographic groups most similar to Hondurans are Haitian (88.1%, a difference of 0.010%), Immigrants from Uruguay (88.1%, a difference of 0.030%), Immigrants from Latvia (88.1%, a difference of 0.030%), Colombian (88.0%, a difference of 0.040%), and Liberian (88.0%, a difference of 0.040%).
| Demographics | Rating | Rank | 1 or more Vehicles in Household |
| Menominee | 1.9 /100 | #246 | Tragic 88.3% |
| Immigrants | Honduras | 1.7 /100 | #247 | Tragic 88.3% |
| Immigrants | Nigeria | 1.5 /100 | #248 | Tragic 88.2% |
| Blacks/African Americans | 1.4 /100 | #249 | Tragic 88.2% |
| Egyptians | 1.2 /100 | #250 | Tragic 88.2% |
| Immigrants | Serbia | 1.2 /100 | #251 | Tragic 88.2% |
| Immigrants | Uruguay | 1.1 /100 | #252 | Tragic 88.1% |
| Hondurans | 1.0 /100 | #253 | Tragic 88.1% |
| Haitians | 0.9 /100 | #254 | Tragic 88.1% |
| Immigrants | Latvia | 0.9 /100 | #255 | Tragic 88.1% |
| Colombians | 0.9 /100 | #256 | Tragic 88.0% |
| Liberians | 0.9 /100 | #257 | Tragic 88.0% |
| South American Indians | 0.9 /100 | #258 | Tragic 88.0% |
| Nigerians | 0.8 /100 | #259 | Tragic 88.0% |
| Macedonians | 0.6 /100 | #260 | Tragic 87.9% |
Demographics Similar to Immigrants from Ethiopia by 1 or more Vehicles in Household
In terms of 1 or more vehicles in household, the demographic groups most similar to Immigrants from Ethiopia are Ukrainian (89.6%, a difference of 0.0%), Arab (89.6%, a difference of 0.010%), German Russian (89.6%, a difference of 0.020%), Ethiopian (89.6%, a difference of 0.020%), and Immigrants from El Salvador (89.6%, a difference of 0.030%).
| Demographics | Rating | Rank | 1 or more Vehicles in Household |
| Filipinos | 50.0 /100 | #174 | Average 89.7% |
| Immigrants | Burma/Myanmar | 47.6 /100 | #175 | Average 89.7% |
| Immigrants | Sudan | 47.1 /100 | #176 | Average 89.7% |
| Hmong | 45.8 /100 | #177 | Average 89.6% |
| Immigrants | El Salvador | 44.1 /100 | #178 | Average 89.6% |
| German Russians | 44.0 /100 | #179 | Average 89.6% |
| Arabs | 43.3 /100 | #180 | Average 89.6% |
| Immigrants | Ethiopia | 42.5 /100 | #181 | Average 89.6% |
| Ukrainians | 42.4 /100 | #182 | Average 89.6% |
| Ethiopians | 41.2 /100 | #183 | Average 89.6% |
| Immigrants | Bulgaria | 40.7 /100 | #184 | Average 89.6% |
| Immigrants | Brazil | 40.1 /100 | #185 | Average 89.6% |
| Pueblo | 39.9 /100 | #186 | Fair 89.6% |
| South Americans | 39.6 /100 | #187 | Fair 89.5% |
| Immigrants | Nepal | 38.9 /100 | #188 | Fair 89.5% |