Zip Codes with the Highest Percentage of Population Employed in Manufacturing in Spring, TX
RELATED REPORTS & OPTIONS
Manufacturing
Spring
Compare Zip Codes
Map of Zip Codes with the Highest Percentage of Population Employed in Manufacturing in Spring
8.6%
11.4%
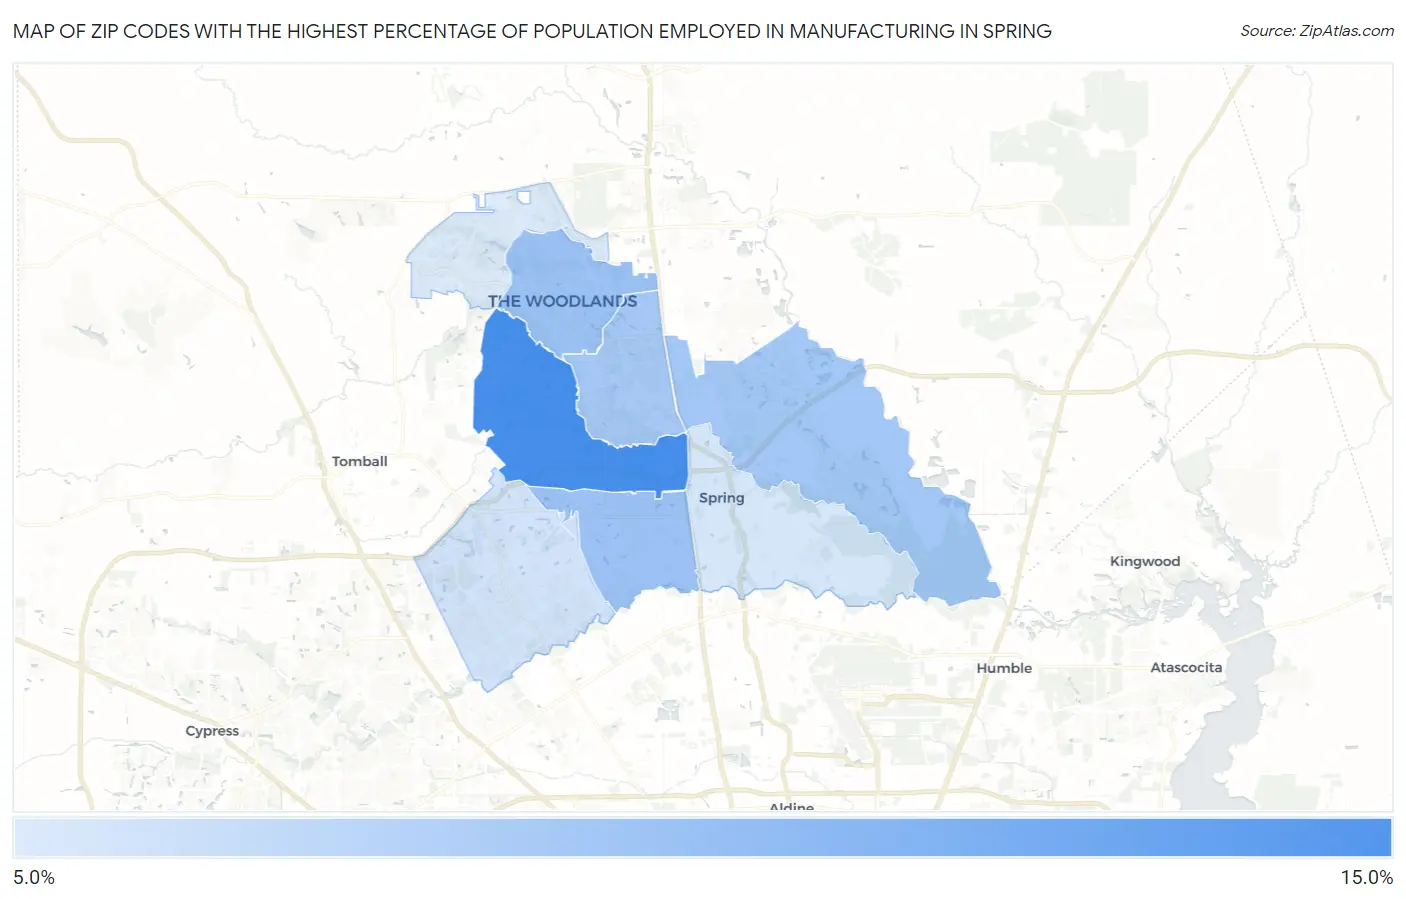
Zip Codes with the Highest Percentage of Population Employed in Manufacturing in Spring, TX
| Zip Code | % Employed | vs State | vs National | |
| 1. | 77389 | 11.4% | 8.5% (+2.90)#420 | 10.0% (+1.40)#13,579 |
| 2. | 77388 | 9.8% | 8.5% (+1.32)#608 | 10.0% (-0.179)#16,068 |
| 3. | 77381 | 9.8% | 8.5% (+1.29)#617 | 10.0% (-0.213)#16,142 |
| 4. | 77386 | 9.7% | 8.5% (+1.19)#629 | 10.0% (-0.313)#16,317 |
| 5. | 77380 | 9.6% | 8.5% (+1.14)#634 | 10.0% (-0.355)#16,394 |
| 6. | 77379 | 8.8% | 8.5% (+0.313)#755 | 10.0% (-1.19)#17,762 |
| 7. | 77373 | 8.7% | 8.5% (+0.245)#769 | 10.0% (-1.25)#17,868 |
| 8. | 77382 | 8.6% | 8.5% (+0.115)#782 | 10.0% (-1.38)#18,104 |
1
Common Questions
What are the Top 5 Zip Codes with the Highest Percentage of Population Employed in Manufacturing in Spring, TX?
Top 5 Zip Codes with the Highest Percentage of Population Employed in Manufacturing in Spring, TX are:
What zip code has the Highest Percentage of Population Employed in Manufacturing in Spring, TX?
77389 has the Highest Percentage of Population Employed in Manufacturing in Spring, TX with 11.4%.
What is the Percentage of Population Employed in Manufacturing in Spring, TX?
Percentage of Population Employed in Manufacturing in Spring is 8.8%.
What is the Percentage of Population Employed in Manufacturing in Texas?
Percentage of Population Employed in Manufacturing in Texas is 8.5%.
What is the Percentage of Population Employed in Manufacturing in the United States?
Percentage of Population Employed in Manufacturing in the United States is 10.0%.