Zip Codes with the Highest Percentage of Population Employed in Professional & Scientific Services in Brownsville, TX
RELATED REPORTS & OPTIONS
Professional & Scientific Services
Brownsville
Compare Zip Codes
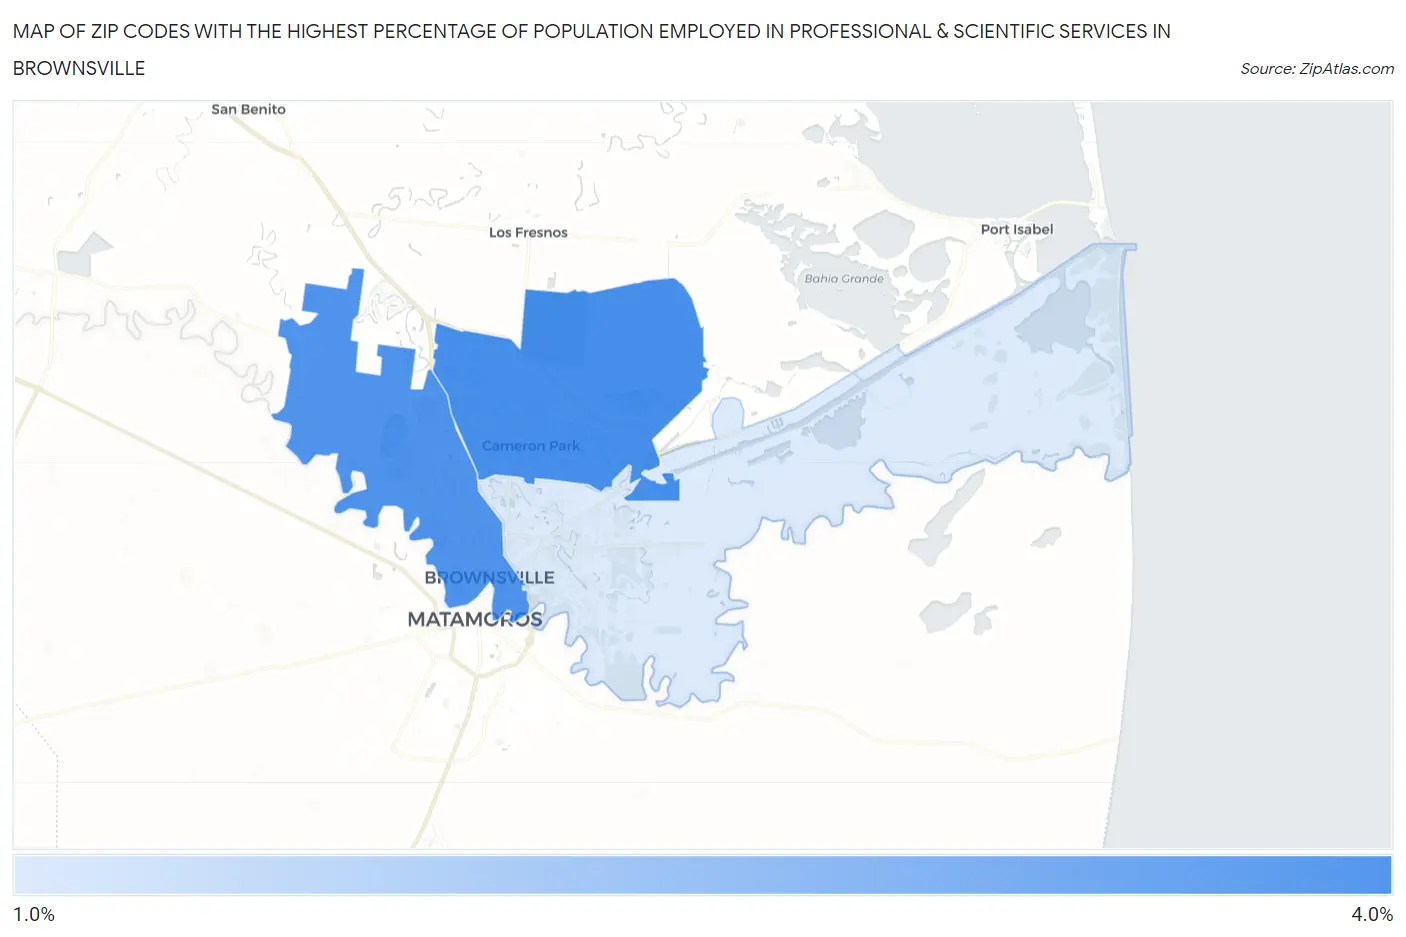
Map of Zip Codes with the Highest Percentage of Population Employed in Professional & Scientific Services in Brownsville
1.6%
3.9%
Zip Codes with the Highest Percentage of Population Employed in Professional & Scientific Services in Brownsville, TX
| Zip Code | % Employed | vs State | vs National | |
| 1. | 78526 | 3.9% | 7.6%(-3.68)#908 | 7.8%(-3.92)#15,329 |
| 2. | 78520 | 3.8% | 7.6%(-3.78)#926 | 7.8%(-4.03)#15,661 |
| 3. | 78521 | 1.6% | 7.6%(-5.95)#1,358 | 7.8%(-6.20)#23,072 |
1
Common Questions
What are the Top Zip Codes with the Highest Percentage of Population Employed in Professional & Scientific Services in Brownsville, TX?
Top Zip Codes with the Highest Percentage of Population Employed in Professional & Scientific Services in Brownsville, TX are:
What zip code has the Highest Percentage of Population Employed in Professional & Scientific Services in Brownsville, TX?
78526 has the Highest Percentage of Population Employed in Professional & Scientific Services in Brownsville, TX with 3.9%.
What is the Percentage of Population Employed in Professional & Scientific Services in Brownsville, TX?
Percentage of Population Employed in Professional & Scientific Services in Brownsville is 3.0%.
What is the Percentage of Population Employed in Professional & Scientific Services in Texas?
Percentage of Population Employed in Professional & Scientific Services in Texas is 7.6%.
What is the Percentage of Population Employed in Professional & Scientific Services in the United States?
Percentage of Population Employed in Professional & Scientific Services in the United States is 7.8%.