Zip Codes with the Highest Percentage of Population Taking Taxi / Cab to Work in Brownsville, TX
RELATED REPORTS & OPTIONS
Taxi / Cab
Brownsville
Compare Zip Codes
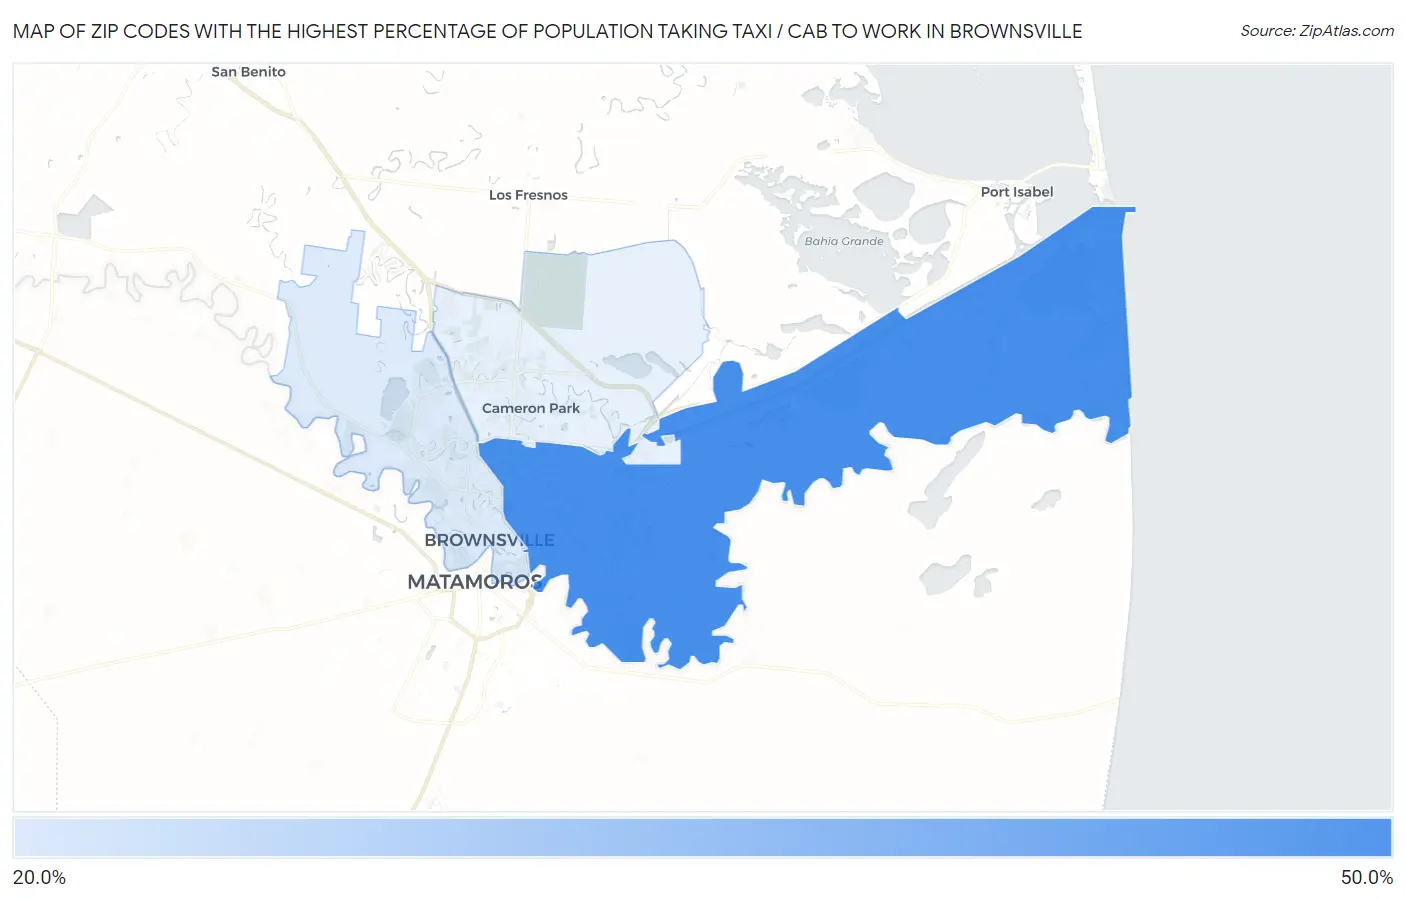
Map of Zip Codes with the Highest Percentage of Population Taking Taxi / Cab to Work in Brownsville
29.8%
40.2%
Zip Codes with the Highest Percentage of Population Taking Taxi / Cab to Work in Brownsville, TX
| Zip Code | % Take Taxi / Cab | vs State | vs National | |
| 1. | 78521 | 40.2% | 36.9%(+3.30)#401 | 38.2%(+2.00)#6,518 |
| 2. | 78520 | 29.8% | 36.9%(-7.10)#693 | 38.2%(-8.40)#10,966 |
1
Common Questions
What are the Top Zip Codes with the Highest Percentage of Population Taking Taxi / Cab to Work in Brownsville, TX?
Top Zip Codes with the Highest Percentage of Population Taking Taxi / Cab to Work in Brownsville, TX are:
What zip code has the Highest Percentage of Population Taking Taxi / Cab to Work in Brownsville, TX?
78521 has the Highest Percentage of Population Taking Taxi / Cab to Work in Brownsville, TX with 40.2%.
What is the Percentage of Population Taking Taxi / Cab to Work in Brownsville, TX?
Percentage of Population Taking Taxi / Cab to Work in Brownsville is 36.9%.
What is the Percentage of Population Taking Taxi / Cab to Work in Texas?
Percentage of Population Taking Taxi / Cab to Work in Texas is 36.9%.
What is the Percentage of Population Taking Taxi / Cab to Work in the United States?
Percentage of Population Taking Taxi / Cab to Work in the United States is 38.2%.