Zip Codes with the Most Immigrants from South Central Asia in Knoxville, TN

RELATED REPORTS & OPTIONS

South Central Asia
Population
Families and Households
Female Fertility
Female Fertility (Unmarried)
Race (Community Size)
Race (Percentage)
Ancestry (Community Size)
AfghanAfricanAlbanianAleutAmericanApacheArabArgentineanArmenianAustralianAustrianBahamianBasqueBelgianBhutaneseBlackfeetBolivianBrazilianBritishBritish West IndianBulgarianBurmeseCajunCanadianCelticCentral AmericanCentral American IndianCherokeeChickasawChileanChippewaChoctawColombianCosta RicanCroatianCubanCzechCzechoslovakianDanishDelawareDominicanDutchDutch West IndianEastern EuropeanEcuadorianEgyptianEnglishEstonianEthiopianEuropeanFilipinoFinnishFrenchFrench American IndianFrench CanadianGermanGhanaianGreekGuatemalanGuyaneseHaitianHonduranHungarianIcelanderIndian (Asian)IndonesianInupiatIranianIraqiIrishIroquoisIsraeliItalianJamaicanJapaneseJordanianKoreanLaotianLatvianLebaneseLithuanianLumbeeLuxembourgerMalaysianMalteseMexicanMexican American IndianMongolianNative HawaiianNavajoNicaraguanNigerianNorthern EuropeanNorwegianPakistaniPalestinianPanamanianPennsylvania GermanPeruvianPolishPortuguesePotawatomiPuerto RicanRomanianRussianSalvadoranSamoanScandinavianScotch-IrishScottishSeminoleSerbianSiouxSlavicSlovakSloveneSomaliSouth AfricanSouth AmericanSpaniardSpanishSri LankanSubsaharan AfricanSwedishSwissSyrianThaiTurkishUkrainianVenezuelanWelshWest IndianYugoslavian
Ancestry (Percentage)
AfghanAfricanAlbanianAleutAmericanApacheArabArgentineanArmenianAustralianAustrianBahamianBasqueBelgianBhutaneseBlackfeetBolivianBrazilianBritishBritish West IndianBulgarianBurmeseCajunCanadianCelticCentral AmericanCentral American IndianCherokeeChickasawChileanChippewaChoctawColombianCosta RicanCroatianCubanCzechCzechoslovakianDanishDelawareDominicanDutchDutch West IndianEastern EuropeanEcuadorianEgyptianEnglishEstonianEthiopianEuropeanFilipinoFinnishFrenchFrench American IndianFrench CanadianGermanGhanaianGreekGuatemalanGuyaneseHaitianHonduranHungarianIcelanderIndian (Asian)IndonesianInupiatIranianIraqiIrishIroquoisIsraeliItalianJamaicanJapaneseJordanianKoreanLaotianLatvianLebaneseLithuanianLumbeeLuxembourgerMalaysianMalteseMexicanMexican American IndianMongolianNative HawaiianNavajoNicaraguanNigerianNorthern EuropeanNorwegianPakistaniPalestinianPanamanianPennsylvania GermanPeruvianPolishPortuguesePotawatomiPuerto RicanRomanianRussianSalvadoranSamoanScandinavianScotch-IrishScottishSeminoleSerbianSiouxSlavicSlovakSloveneSomaliSouth AfricanSouth AmericanSpaniardSpanishSri LankanSubsaharan AfricanSwedishSwissSyrianThaiTurkishUkrainianVenezuelanWelshWest IndianYugoslavian
Immigrant Origin (Total)
AfghanistanAfricaArgentinaAsiaAustraliaBangladeshBoliviaBosnia and HerzegovinaBrazilBulgariaBurma / MyanmarCambodiaCameroonCanadaCaribbeanCentral AmericaChileChinaColombiaCongoCosta RicaCubaCzechoslovakiaDominican RepublicEastern AfricaEastern AsiaEastern EuropeEcuadorEgyptEl SalvadorEnglandEthiopiaEuropeFranceGermanyGhanaGreeceGuatemalaHaitiHondurasHong KongIndiaIndonesiaIranIraqIrelandIsraelItalyJamaicaJapanJordanKazakhstanKenyaKoreaKuwaitLatin AmericaLebanonLiberiaMalaysiaMexicoMiddle AfricaMoldovaMoroccoNepalNicaraguaNigeriaNorthern AfricaNorthern EuropeOceaniaPakistanPanamaPeruPhilippinesPolandRomaniaRussiaSaudi ArabiaScotlandSenegalSouth AfricaSouth AmericaSouth Central AsiaSouth Eastern AsiaSouthern EuropeSri LankaSudanTaiwanThailandTurkeyUkraineUzbekistanVenezuelaVietnamWestern AfricaWestern AsiaWestern EuropeZaireZimbabwe
Immigrant Origin (Percentage)
AfghanistanAfricaArgentinaAsiaAustraliaBangladeshBoliviaBosnia and HerzegovinaBrazilBulgariaBurma / MyanmarCambodiaCameroonCanadaCaribbeanCentral AmericaChileChinaColombiaCongoCosta RicaCubaCzechoslovakiaDominican RepublicEastern AfricaEastern AsiaEastern EuropeEcuadorEgyptEl SalvadorEnglandEthiopiaEuropeFranceGermanyGhanaGreeceGuatemalaHaitiHondurasHong KongIndiaIndonesiaIranIraqIrelandIsraelItalyJamaicaJapanJordanKazakhstanKenyaKoreaKuwaitLatin AmericaLebanonLiberiaMalaysiaMexicoMiddle AfricaMoldovaMoroccoNepalNicaraguaNigeriaNorthern AfricaNorthern EuropeOceaniaPakistanPanamaPeruPhilippinesPolandRomaniaRussiaSaudi ArabiaScotlandSenegalSouth AfricaSouth AmericaSouth Central AsiaSouth Eastern AsiaSouthern EuropeSri LankaSudanTaiwanThailandTurkeyUkraineUzbekistanVenezuelaVietnamWestern AfricaWestern AsiaWestern EuropeZaireZimbabwe
Income
Income (Families)
Income (Households)
Poverty
Poverty (Families)
Unemployment
Employment Occupations
Employment Industries
Employer Class
Commute Time
Commute Means
School Enrollment
Education by Degree Field
Occupancy
Finances
Physical Characteristics
Knoxville
Compare Zip Codes
Comparison Subject

Map of Zip Codes with the Most Immigrants from South Central Asia in Knoxville

7
717
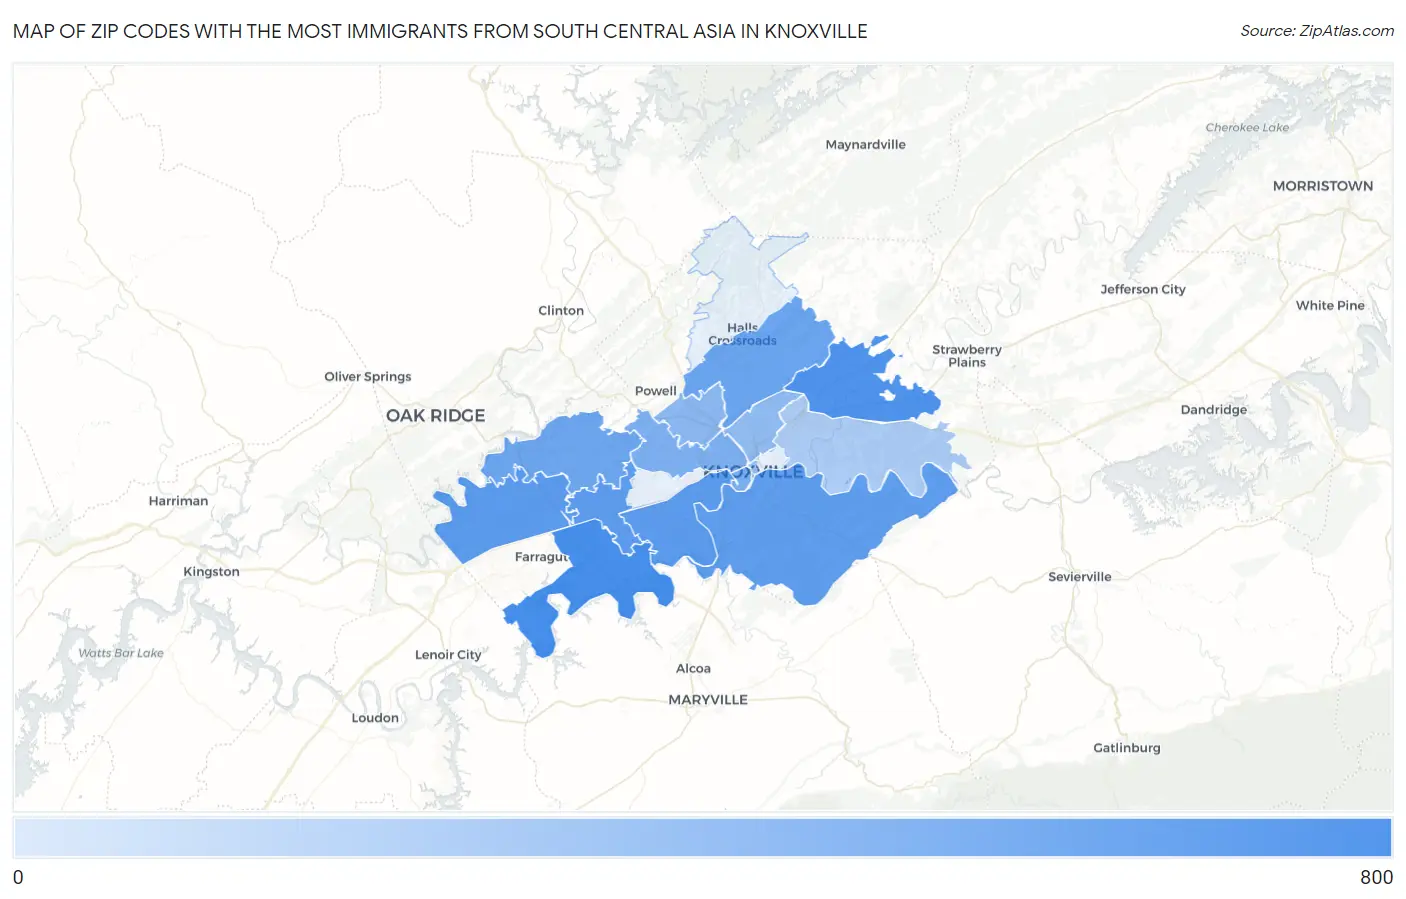
Zip Codes with the Most Immigrants from South Central Asia in Knoxville Map

Zip Codes with the Most Immigrants from South Central Asia in Knoxville, TN

Zip Code South Central Asia vs State vs National
1. 37922 717 34,050 (2.11%)#10 4,330,976 (0.02%)#1,453
2. 37924 511 34,050 (1.50%)#14 4,330,976 (0.01%)#1,978
3. 37919 308 34,050 (0.90%)#24 4,330,976 (0.01%)#2,893
4. 37932 303 34,050 (0.89%)#25 4,330,976 (0.01%)#2,937
5. 37923 253 34,050 (0.74%)#36 4,330,976 (0.01%)#3,328
6. 37920 224 34,050 (0.66%)#43 4,330,976 (0.01%)#3,601
7. 37918 142 34,050 (0.42%)#54 4,330,976 (0.00%)#4,599
8. 37931 131 34,050 (0.38%)#57 4,330,976 (0.00%)#4,794
9. 37916 84 34,050 (0.25%)#70 4,330,976 (0.00%)#5,764
10. 37921 61 34,050 (0.18%)#82 4,330,976 (0.00%)#6,440
11. 37912 35 34,050 (0.10%)#107 4,330,976 (0.00%)#7,489
12. 37917 28 34,050 (0.08%)#118 4,330,976 (0.00%)#7,907
13. 37902 23 34,050 (0.07%)#132 4,330,976 (0.00%)#8,369
14. 37914 7 34,050 (0.02%)#179 4,330,976 (0.00%)#10,113

Common Questions

What are the Top 10 Zip Codes with the Most Immigrants from South Central Asia in Knoxville, TN?
Top 10 Zip Codes with the Most Immigrants from South Central Asia in Knoxville, TN are:
#1
717
#2
511
#3
308
#4
303
#5
253
#6
224
#7
142
#8
131
#9
84
#10
61
What zip code has the Most Immigrants from South Central Asia in Knoxville, TN?
37922 has the Most Immigrants from South Central Asia in Knoxville, TN with 717.
What is the Total Immigrants from South Central Asia in Knoxville, TN?
Total Immigrants from South Central Asia in Knoxville is 769.
What is the Total Immigrants from South Central Asia in Tennessee?
Total Immigrants from South Central Asia in Tennessee is 34,050.
What is the Total Immigrants from South Central Asia in the United States?
Total Immigrants from South Central Asia in the United States is 4,330,976.