Zip Codes with the Highest Percentage of Population Employed in Legal Services & Support in Knoxville, TN
RELATED REPORTS & OPTIONS
Legal Services & Support
Knoxville
Compare Zip Codes
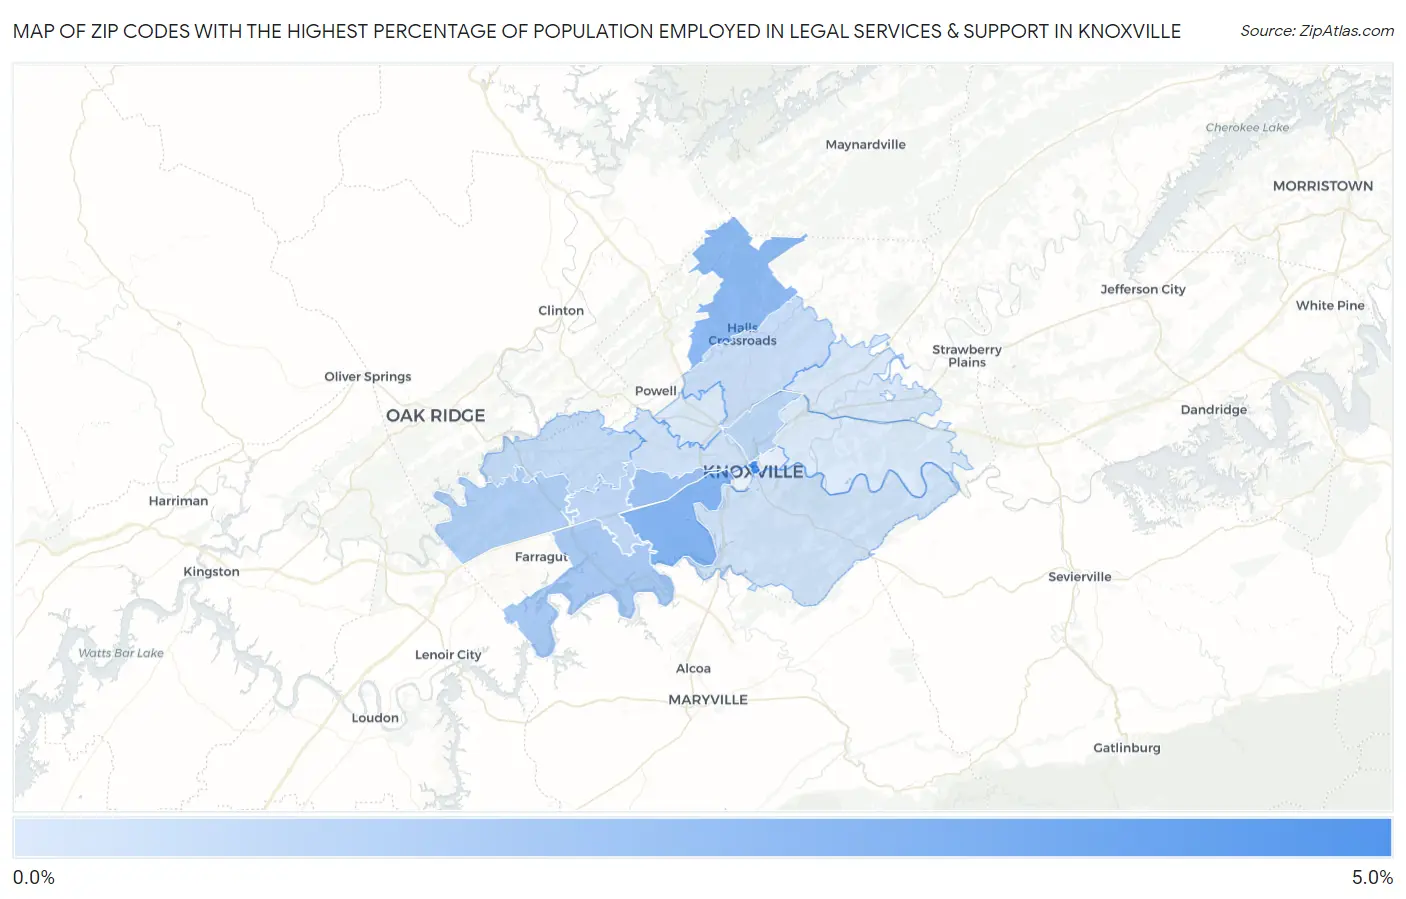
Map of Zip Codes with the Highest Percentage of Population Employed in Legal Services & Support in Knoxville
0.17%
4.9%
Zip Codes with the Highest Percentage of Population Employed in Legal Services & Support in Knoxville, TN
| Zip Code | % Employed | vs State | vs National | |
| 1. | 37902 | 4.9% | 0.90%(+4.01)#8 | 1.2%(+3.73)#743 |
| 2. | 37919 | 2.9% | 0.90%(+2.04)#31 | 1.2%(+1.76)#1,916 |
| 3. | 37938 | 2.6% | 0.90%(+1.73)#37 | 1.2%(+1.45)#2,301 |
| 4. | 37909 | 2.2% | 0.90%(+1.31)#49 | 1.2%(+1.03)#3,018 |
| 5. | 37922 | 1.8% | 0.90%(+0.884)#64 | 1.2%(+0.598)#4,049 |
| 6. | 37932 | 1.5% | 0.90%(+0.628)#75 | 1.2%(+0.342)#4,933 |
| 7. | 37917 | 1.2% | 0.90%(+0.272)#96 | 1.2%(-0.014)#6,709 |
| 8. | 37923 | 1.0% | 0.90%(+0.150)#111 | 1.2%(-0.136)#7,504 |
| 9. | 37931 | 0.86% | 0.90%(-0.036)#140 | 1.2%(-0.322)#8,911 |
| 10. | 37918 | 0.75% | 0.90%(-0.147)#159 | 1.2%(-0.432)#9,909 |
| 11. | 37920 | 0.54% | 0.90%(-0.355)#209 | 1.2%(-0.640)#12,124 |
| 12. | 37921 | 0.53% | 0.90%(-0.370)#212 | 1.2%(-0.656)#12,285 |
| 13. | 37924 | 0.25% | 0.90%(-0.650)#282 | 1.2%(-0.936)#15,660 |
| 14. | 37912 | 0.20% | 0.90%(-0.700)#291 | 1.2%(-0.986)#16,210 |
| 15. | 37914 | 0.17% | 0.90%(-0.728)#300 | 1.2%(-1.01)#16,489 |
1
Common Questions
What are the Top 10 Zip Codes with the Highest Percentage of Population Employed in Legal Services & Support in Knoxville, TN?
Top 10 Zip Codes with the Highest Percentage of Population Employed in Legal Services & Support in Knoxville, TN are:
What zip code has the Highest Percentage of Population Employed in Legal Services & Support in Knoxville, TN?
37902 has the Highest Percentage of Population Employed in Legal Services & Support in Knoxville, TN with 4.9%.
What is the Percentage of Population Employed in Legal Services & Support in Knoxville, TN?
Percentage of Population Employed in Legal Services & Support in Knoxville is 1.0%.
What is the Percentage of Population Employed in Legal Services & Support in Tennessee?
Percentage of Population Employed in Legal Services & Support in Tennessee is 0.90%.
What is the Percentage of Population Employed in Legal Services & Support in the United States?
Percentage of Population Employed in Legal Services & Support in the United States is 1.2%.