Zip Codes with the Highest Percentage of Population Employed in Computer & Mathematics in Franklin, TN
RELATED REPORTS & OPTIONS
Computer & Mathematics
Franklin
Compare Zip Codes
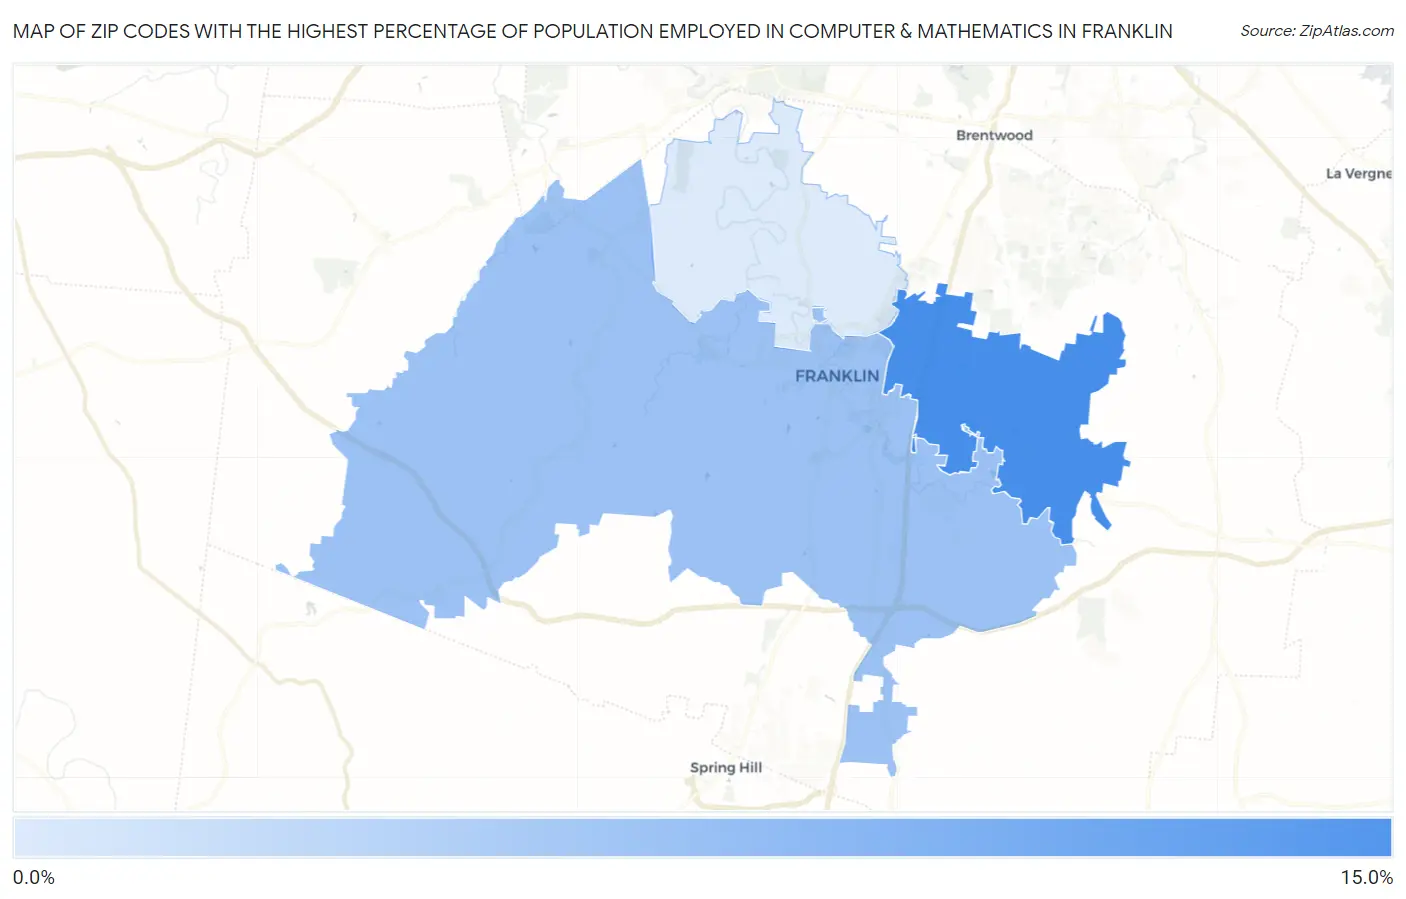
Map of Zip Codes with the Highest Percentage of Population Employed in Computer & Mathematics in Franklin
3.8%
10.1%
Zip Codes with the Highest Percentage of Population Employed in Computer & Mathematics in Franklin, TN
| Zip Code | % Employed | vs State | vs National | |
| 1. | 37067 | 10.1% | 2.6%(+7.50)#5 | 3.5%(+6.56)#697 |
| 2. | 37064 | 6.4% | 2.6%(+3.84)#19 | 3.5%(+2.90)#1,992 |
| 3. | 37069 | 3.8% | 2.6%(+1.17)#80 | 3.5%(+0.231)#5,581 |
1
Common Questions
What are the Top Zip Codes with the Highest Percentage of Population Employed in Computer & Mathematics in Franklin, TN?
Top Zip Codes with the Highest Percentage of Population Employed in Computer & Mathematics in Franklin, TN are:
What zip code has the Highest Percentage of Population Employed in Computer & Mathematics in Franklin, TN?
37067 has the Highest Percentage of Population Employed in Computer & Mathematics in Franklin, TN with 10.1%.
What is the Percentage of Population Employed in Computer & Mathematics in Franklin, TN?
Percentage of Population Employed in Computer & Mathematics in Franklin is 8.0%.
What is the Percentage of Population Employed in Computer & Mathematics in Tennessee?
Percentage of Population Employed in Computer & Mathematics in Tennessee is 2.6%.
What is the Percentage of Population Employed in Computer & Mathematics in the United States?
Percentage of Population Employed in Computer & Mathematics in the United States is 3.5%.