Zip Codes with the Highest Percentage of Population Employed in Legal Services & Support in Franklin, TN
RELATED REPORTS & OPTIONS
Legal Services & Support
Franklin
Compare Zip Codes
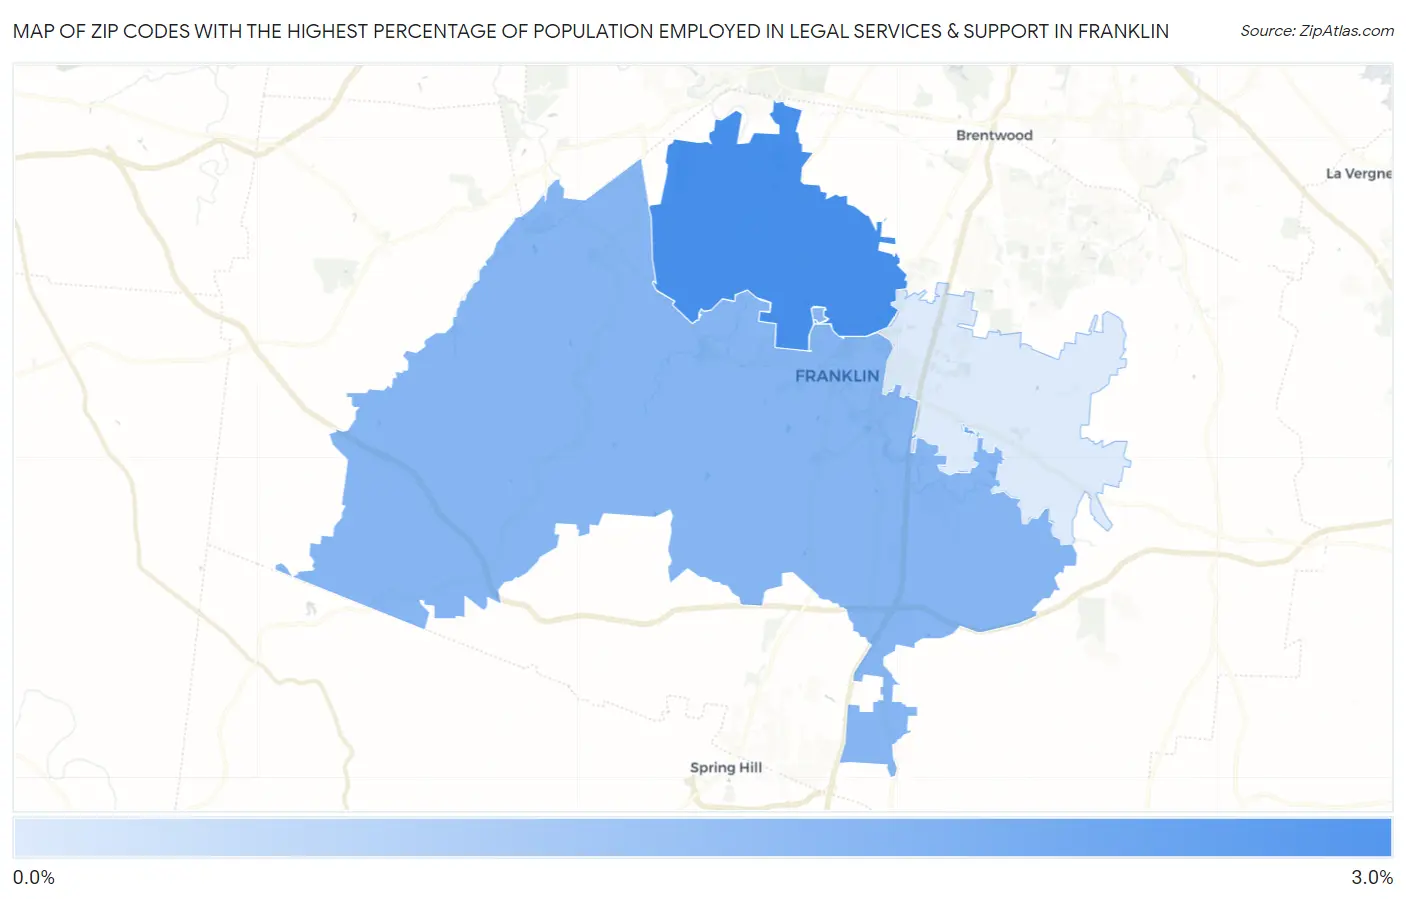
Map of Zip Codes with the Highest Percentage of Population Employed in Legal Services & Support in Franklin
0.93%
2.8%
Zip Codes with the Highest Percentage of Population Employed in Legal Services & Support in Franklin, TN
| Zip Code | % Employed | vs State | vs National | |
| 1. | 37069 | 2.8% | 0.90%(+1.92)#32 | 1.2%(+1.63)#2,063 |
| 2. | 37064 | 2.0% | 0.90%(+1.12)#57 | 1.2%(+0.837)#3,416 |
| 3. | 37067 | 0.93% | 0.90%(+0.035)#130 | 1.2%(-0.251)#8,332 |
1
Common Questions
What are the Top Zip Codes with the Highest Percentage of Population Employed in Legal Services & Support in Franklin, TN?
Top Zip Codes with the Highest Percentage of Population Employed in Legal Services & Support in Franklin, TN are:
What zip code has the Highest Percentage of Population Employed in Legal Services & Support in Franklin, TN?
37069 has the Highest Percentage of Population Employed in Legal Services & Support in Franklin, TN with 2.8%.
What is the Percentage of Population Employed in Legal Services & Support in Franklin, TN?
Percentage of Population Employed in Legal Services & Support in Franklin is 1.7%.
What is the Percentage of Population Employed in Legal Services & Support in Tennessee?
Percentage of Population Employed in Legal Services & Support in Tennessee is 0.90%.
What is the Percentage of Population Employed in Legal Services & Support in the United States?
Percentage of Population Employed in Legal Services & Support in the United States is 1.2%.