Zip Codes with the Highest Percentage of Population Employed in Accommodation & Food Services in West Chester, PA
RELATED REPORTS & OPTIONS
Accommodation & Food Services
West Chester
Compare Zip Codes
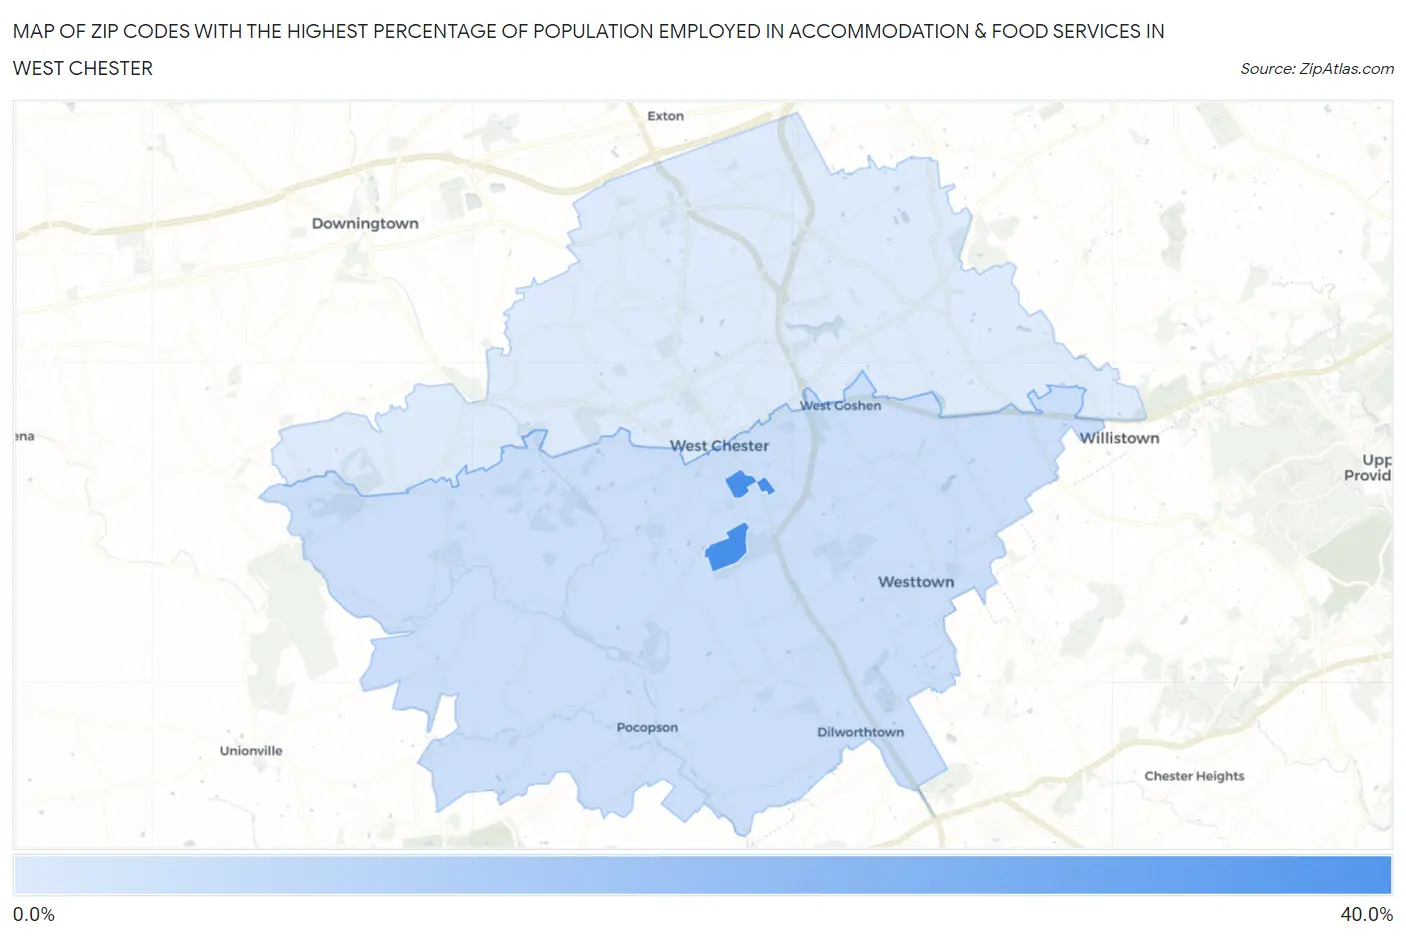
Map of Zip Codes with the Highest Percentage of Population Employed in Accommodation & Food Services in West Chester
2.8%
35.2%
Zip Codes with the Highest Percentage of Population Employed in Accommodation & Food Services in West Chester, PA
| Zip Code | % Employed | vs State | vs National | |
| 1. | 19383 | 35.2% | 5.9%(+29.3)#14 | 6.9%(+28.3)#221 |
| 2. | 19382 | 6.2% | 5.9%(+0.349)#608 | 6.9%(-0.642)#12,684 |
| 3. | 19380 | 2.8% | 5.9%(-3.06)#1,321 | 6.9%(-4.05)#23,662 |
1
Common Questions
What are the Top Zip Codes with the Highest Percentage of Population Employed in Accommodation & Food Services in West Chester, PA?
Top Zip Codes with the Highest Percentage of Population Employed in Accommodation & Food Services in West Chester, PA are:
What zip code has the Highest Percentage of Population Employed in Accommodation & Food Services in West Chester, PA?
19383 has the Highest Percentage of Population Employed in Accommodation & Food Services in West Chester, PA with 35.2%.
What is the Percentage of Population Employed in Accommodation & Food Services in Pennsylvania?
Percentage of Population Employed in Accommodation & Food Services in Pennsylvania is 5.9%.
What is the Percentage of Population Employed in Accommodation & Food Services in the United States?
Percentage of Population Employed in Accommodation & Food Services in the United States is 6.9%.