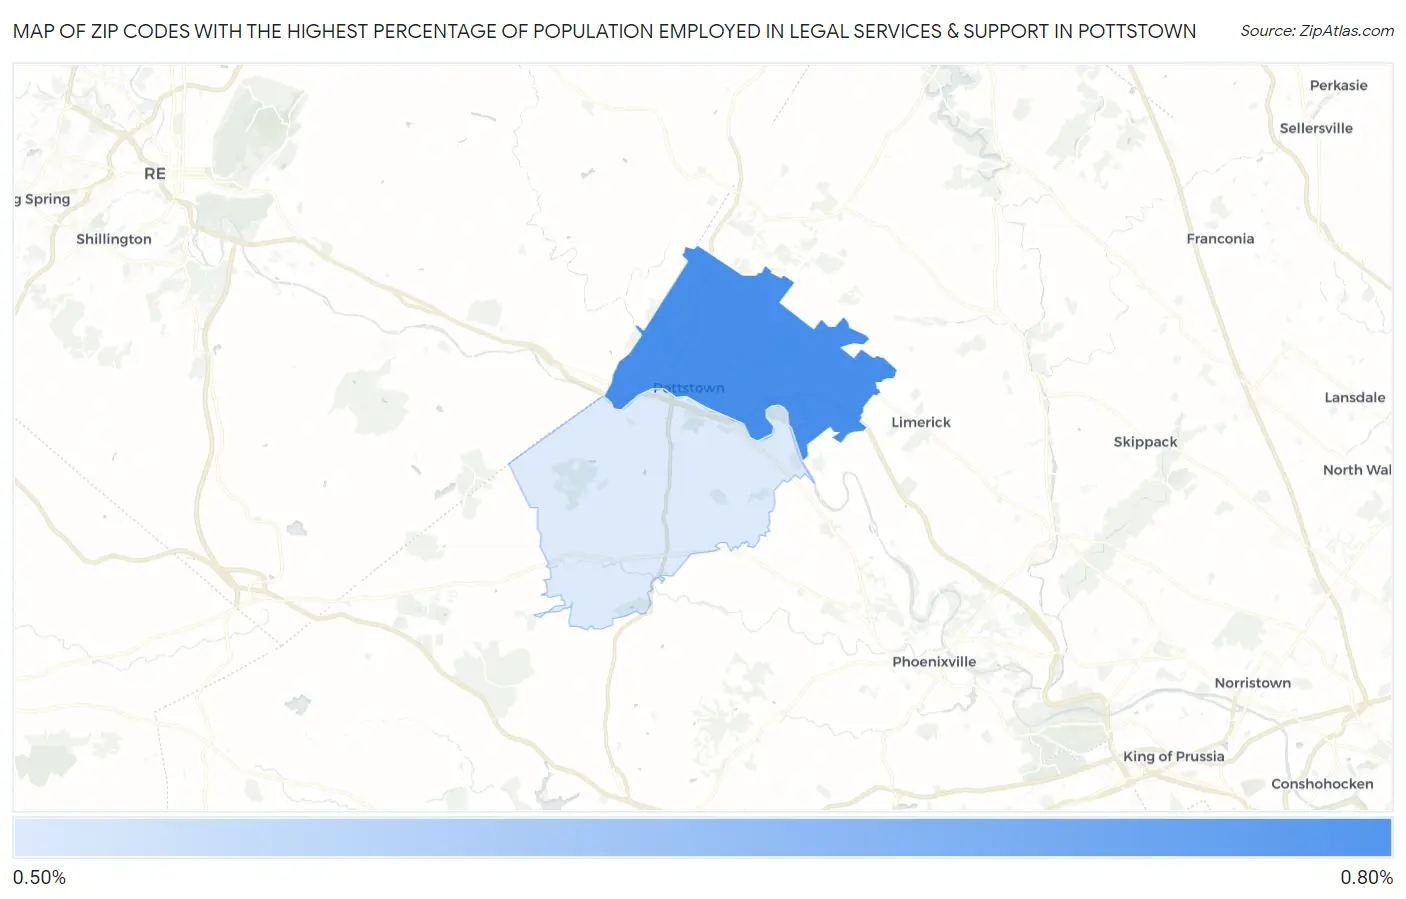
Zip Codes with the Highest Percentage of Population Employed in Legal Services & Support in Pottstown, PA
RELATED REPORTS & OPTIONS
Legal Services & Support
Pottstown
Compare Zip Codes
Map of Zip Codes with the Highest Percentage of Population Employed in Legal Services & Support in Pottstown
0.52%
0.61%
Zip Codes with the Highest Percentage of Population Employed in Legal Services & Support in Pottstown, PA
| Zip Code | % Employed | vs State | vs National | |
| 1. | 19464 | 0.61% | 1.1%(-0.538)#546 | 1.2%(-0.574)#11,358 |
| 2. | 19465 | 0.52% | 1.1%(-0.623)#608 | 1.2%(-0.660)#12,324 |
1
Common Questions
What are the Top Zip Codes with the Highest Percentage of Population Employed in Legal Services & Support in Pottstown, PA?
Top Zip Codes with the Highest Percentage of Population Employed in Legal Services & Support in Pottstown, PA are:
What zip code has the Highest Percentage of Population Employed in Legal Services & Support in Pottstown, PA?
19464 has the Highest Percentage of Population Employed in Legal Services & Support in Pottstown, PA with 0.61%.
What is the Percentage of Population Employed in Legal Services & Support in Pennsylvania?
Percentage of Population Employed in Legal Services & Support in Pennsylvania is 1.1%.
What is the Percentage of Population Employed in Legal Services & Support in the United States?
Percentage of Population Employed in Legal Services & Support in the United States is 1.2%.