Zip Codes with the Highest Percentage of Population Employed in Real Estate, Rental & Leasing in Pottstown, PA
RELATED REPORTS & OPTIONS
Real Estate, Rental & Leasing
Pottstown
Compare Zip Codes
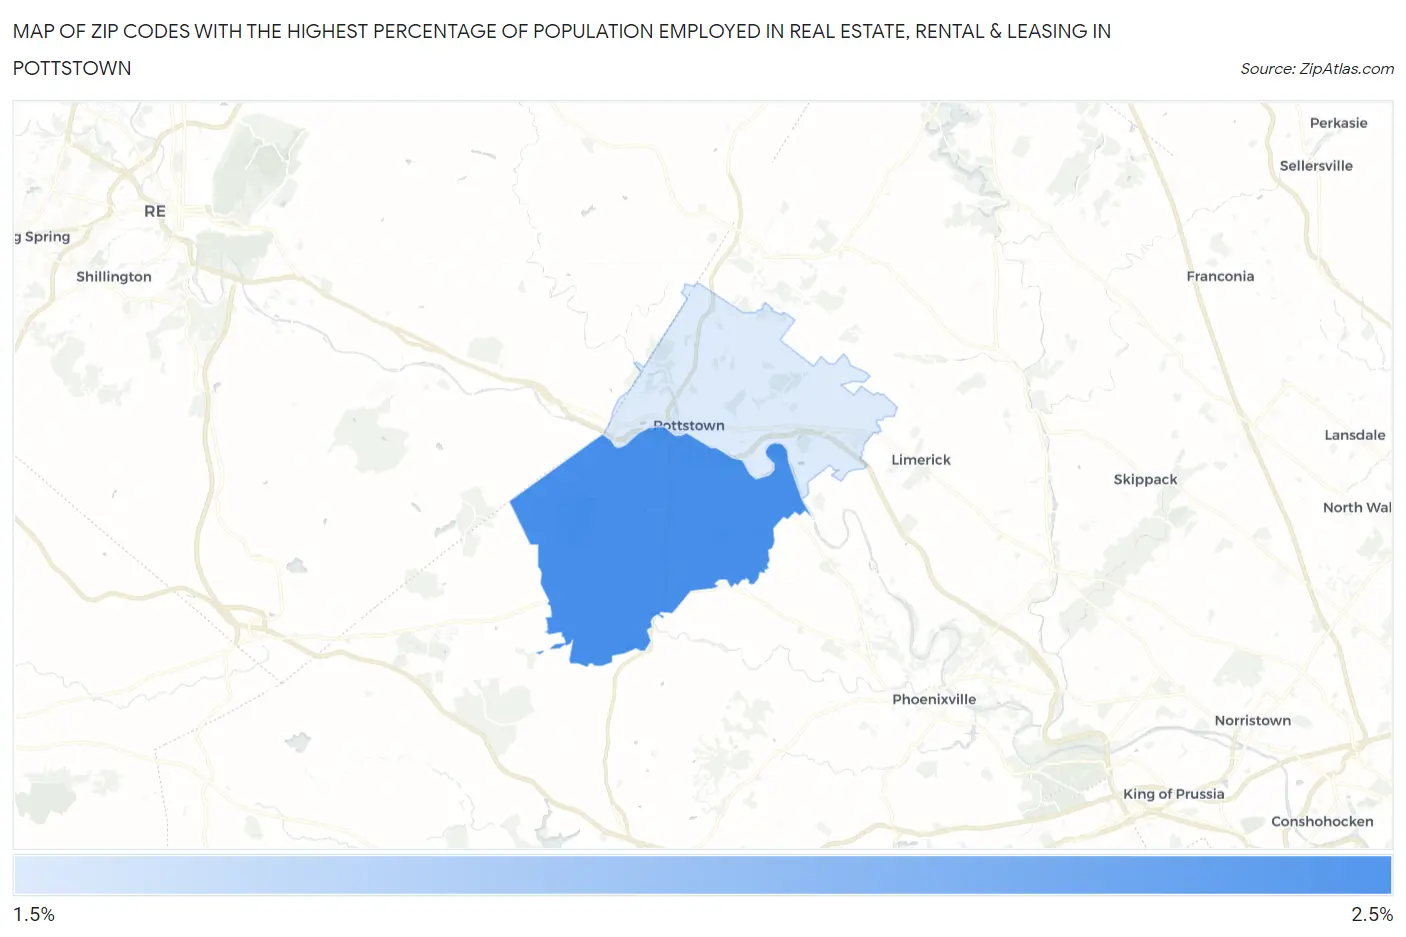
Map of Zip Codes with the Highest Percentage of Population Employed in Real Estate, Rental & Leasing in Pottstown
1.7%
2.2%
Zip Codes with the Highest Percentage of Population Employed in Real Estate, Rental & Leasing in Pottstown, PA
| Zip Code | % Employed | vs State | vs National | |
| 1. | 19465 | 2.2% | 1.5%(+0.737)#232 | 1.9%(+0.338)#6,660 |
| 2. | 19464 | 1.7% | 1.5%(+0.165)#410 | 1.9%(-0.234)#10,065 |
1
Common Questions
What are the Top Zip Codes with the Highest Percentage of Population Employed in Real Estate, Rental & Leasing in Pottstown, PA?
Top Zip Codes with the Highest Percentage of Population Employed in Real Estate, Rental & Leasing in Pottstown, PA are:
What zip code has the Highest Percentage of Population Employed in Real Estate, Rental & Leasing in Pottstown, PA?
19465 has the Highest Percentage of Population Employed in Real Estate, Rental & Leasing in Pottstown, PA with 2.2%.
What is the Percentage of Population Employed in Real Estate, Rental & Leasing in Pennsylvania?
Percentage of Population Employed in Real Estate, Rental & Leasing in Pennsylvania is 1.5%.
What is the Percentage of Population Employed in Real Estate, Rental & Leasing in the United States?
Percentage of Population Employed in Real Estate, Rental & Leasing in the United States is 1.9%.