Zip Codes with the Highest Percentage of Population Taking Taxi / Cab to Work in Claremore, OK
RELATED REPORTS & OPTIONS
Taxi / Cab
Claremore
Compare Zip Codes
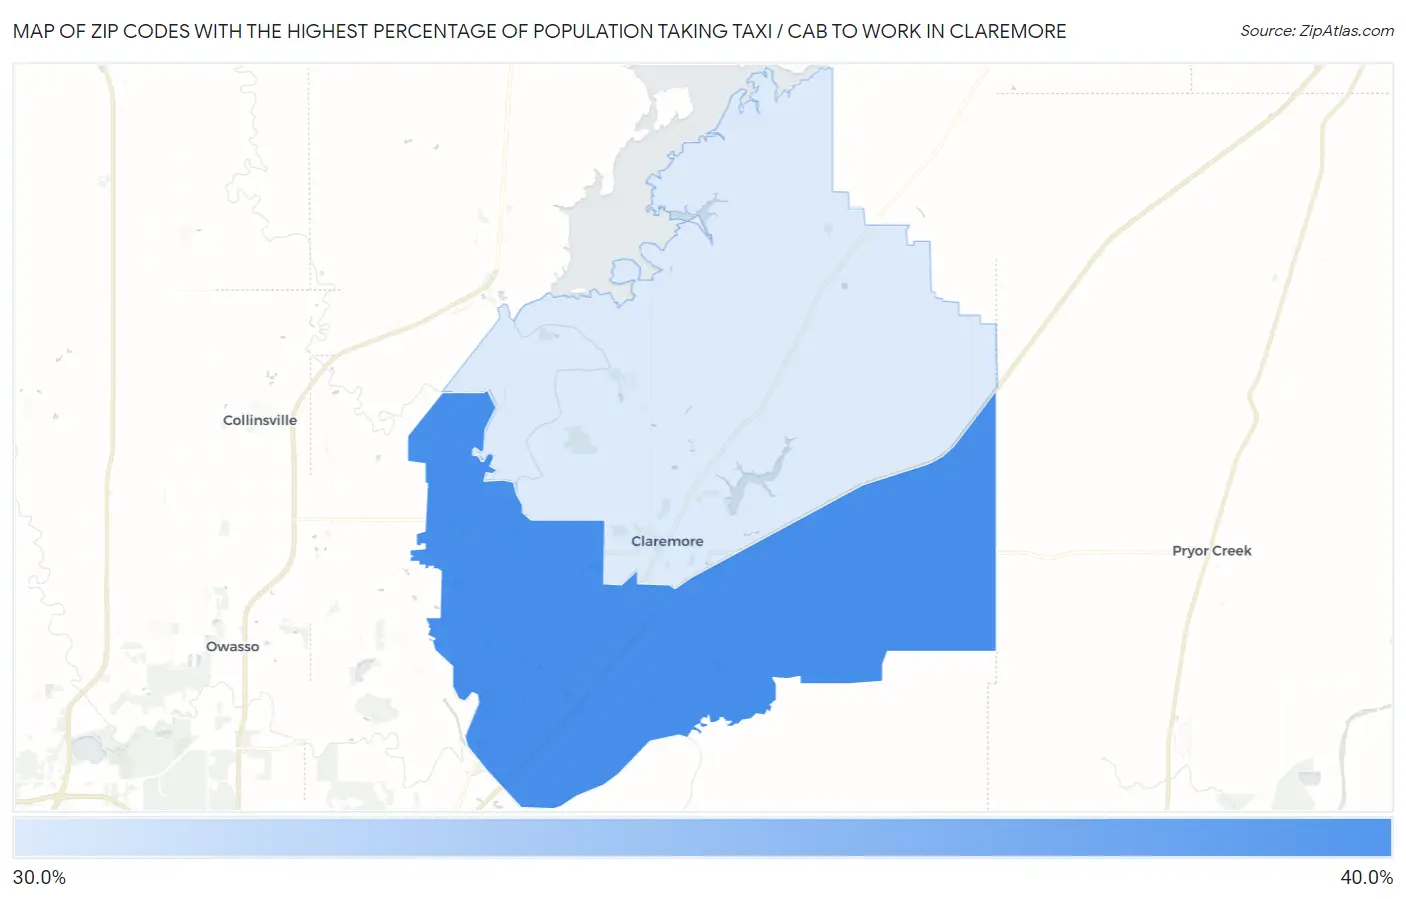
Map of Zip Codes with the Highest Percentage of Population Taking Taxi / Cab to Work in Claremore
32.9%
33.6%
Zip Codes with the Highest Percentage of Population Taking Taxi / Cab to Work in Claremore, OK
| Zip Code | % Take Taxi / Cab | vs State | vs National | |
| 1. | 74019 | 33.6% | 37.2%(-3.60)#169 | 38.2%(-4.60)#9,534 |
| 2. | 74017 | 32.9% | 37.2%(-4.30)#175 | 38.2%(-5.30)#9,794 |
1
Common Questions
What are the Top Zip Codes with the Highest Percentage of Population Taking Taxi / Cab to Work in Claremore, OK?
Top Zip Codes with the Highest Percentage of Population Taking Taxi / Cab to Work in Claremore, OK are:
What zip code has the Highest Percentage of Population Taking Taxi / Cab to Work in Claremore, OK?
74019 has the Highest Percentage of Population Taking Taxi / Cab to Work in Claremore, OK with 33.6%.
What is the Percentage of Population Taking Taxi / Cab to Work in Claremore, OK?
Percentage of Population Taking Taxi / Cab to Work in Claremore is 32.8%.
What is the Percentage of Population Taking Taxi / Cab to Work in Oklahoma?
Percentage of Population Taking Taxi / Cab to Work in Oklahoma is 37.2%.
What is the Percentage of Population Taking Taxi / Cab to Work in the United States?
Percentage of Population Taking Taxi / Cab to Work in the United States is 38.2%.