Zip Codes with the Most Immigrants from Japan in New Mexico
RELATED REPORTS & OPTIONS
Japan
New Mexico
Compare Zip Codes
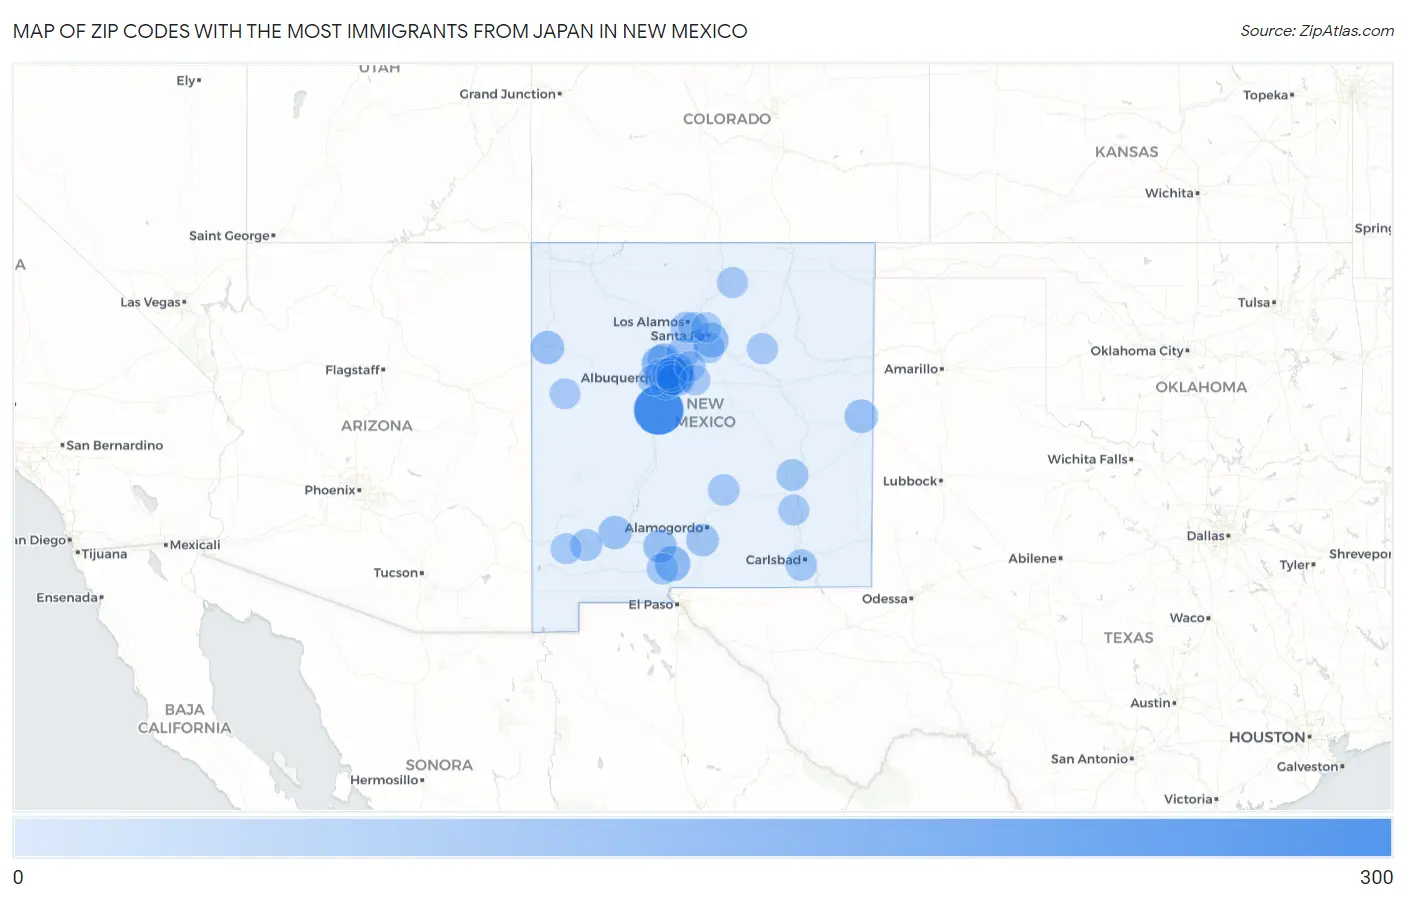
Map of Zip Codes with the Most Immigrants from Japan in New Mexico
0
300
Zip Codes with the Most Immigrants from Japan in New Mexico
| Zip Code | Japan | vs State | vs National | |
| 1. | 87002 | 258 | 1,338(19.28%)#1 | 342,380(0.08%)#212 |
| 2. | 87112 | 88 | 1,338(6.58%)#2 | 342,380(0.03%)#944 |
| 3. | 87111 | 82 | 1,338(6.13%)#3 | 342,380(0.02%)#1,025 |
| 4. | 87124 | 80 | 1,338(5.98%)#4 | 342,380(0.02%)#1,051 |
| 5. | 88011 | 68 | 1,338(5.08%)#5 | 342,380(0.02%)#1,240 |
| 6. | 87505 | 57 | 1,338(4.26%)#6 | 342,380(0.02%)#1,494 |
| 7. | 87123 | 54 | 1,338(4.04%)#7 | 342,380(0.02%)#1,567 |
| 8. | 88101 | 43 | 1,338(3.21%)#8 | 342,380(0.01%)#1,941 |
| 9. | 88012 | 42 | 1,338(3.14%)#9 | 342,380(0.01%)#1,982 |
| 10. | 87301 | 40 | 1,338(2.99%)#10 | 342,380(0.01%)#2,079 |
| 11. | 88042 | 40 | 1,338(2.99%)#11 | 342,380(0.01%)#2,092 |
| 12. | 87144 | 37 | 1,338(2.77%)#12 | 342,380(0.01%)#2,181 |
| 13. | 87001 | 33 | 1,338(2.47%)#13 | 342,380(0.01%)#2,393 |
| 14. | 87122 | 32 | 1,338(2.39%)#14 | 342,380(0.01%)#2,440 |
| 15. | 88310 | 30 | 1,338(2.24%)#15 | 342,380(0.01%)#2,523 |
| 16. | 87120 | 29 | 1,338(2.17%)#16 | 342,380(0.01%)#2,564 |
| 17. | 87106 | 27 | 1,338(2.02%)#17 | 342,380(0.01%)#2,682 |
| 18. | 87113 | 27 | 1,338(2.02%)#18 | 342,380(0.01%)#2,692 |
| 19. | 87108 | 21 | 1,338(1.57%)#19 | 342,380(0.01%)#3,118 |
| 20. | 87105 | 19 | 1,338(1.42%)#20 | 342,380(0.01%)#3,290 |
| 21. | 87109 | 19 | 1,338(1.42%)#21 | 342,380(0.01%)#3,298 |
| 22. | 88201 | 19 | 1,338(1.42%)#22 | 342,380(0.01%)#3,322 |
| 23. | 88043 | 19 | 1,338(1.42%)#23 | 342,380(0.01%)#3,367 |
| 24. | 88220 | 16 | 1,338(1.20%)#24 | 342,380(0.00%)#3,614 |
| 25. | 88001 | 16 | 1,338(1.20%)#25 | 342,380(0.00%)#3,615 |
| 26. | 88312 | 15 | 1,338(1.12%)#26 | 342,380(0.00%)#3,829 |
| 27. | 87121 | 14 | 1,338(1.05%)#27 | 342,380(0.00%)#3,837 |
| 28. | 87544 | 13 | 1,338(0.97%)#28 | 342,380(0.00%)#4,088 |
| 29. | 87107 | 12 | 1,338(0.90%)#29 | 342,380(0.00%)#4,201 |
| 30. | 87508 | 11 | 1,338(0.82%)#30 | 342,380(0.00%)#4,372 |
| 31. | 87547 | 10 | 1,338(0.75%)#31 | 342,380(0.00%)#4,601 |
| 32. | 87116 | 10 | 1,338(0.75%)#32 | 342,380(0.00%)#4,607 |
| 33. | 87701 | 9 | 1,338(0.67%)#33 | 342,380(0.00%)#4,744 |
| 34. | 87571 | 9 | 1,338(0.67%)#34 | 342,380(0.00%)#4,771 |
| 35. | 87110 | 8 | 1,338(0.60%)#35 | 342,380(0.00%)#4,851 |
| 36. | 88203 | 8 | 1,338(0.60%)#36 | 342,380(0.00%)#4,881 |
| 37. | 88061 | 8 | 1,338(0.60%)#37 | 342,380(0.00%)#4,924 |
| 38. | 87047 | 5 | 1,338(0.37%)#38 | 342,380(0.00%)#5,506 |
| 39. | 87357 | 5 | 1,338(0.37%)#39 | 342,380(0.00%)#5,551 |
| 40. | 87015 | 3 | 1,338(0.22%)#40 | 342,380(0.00%)#5,784 |
| 41. | 87506 | 2 | 1,338(0.15%)#41 | 342,380(0.00%)#5,918 |
Common Questions
What are the Top 10 Zip Codes with the Most Immigrants from Japan in New Mexico?
Top 10 Zip Codes with the Most Immigrants from Japan in New Mexico are:
What zip code has the Most Immigrants from Japan in New Mexico?
87002 has the Most Immigrants from Japan in New Mexico with 258.
What is the Total Immigrants from Japan in the State of New Mexico?
Total Immigrants from Japan in New Mexico is 1,338.
What is the Total Immigrants from Japan in the United States?
Total Immigrants from Japan in the United States is 342,380.