Zip Codes with the Highest Percentage of Families with Income Above $200,000 in Gallup, NM
RELATED REPORTS & OPTIONS
Family Income | $200k+
Gallup
Compare Zip Codes
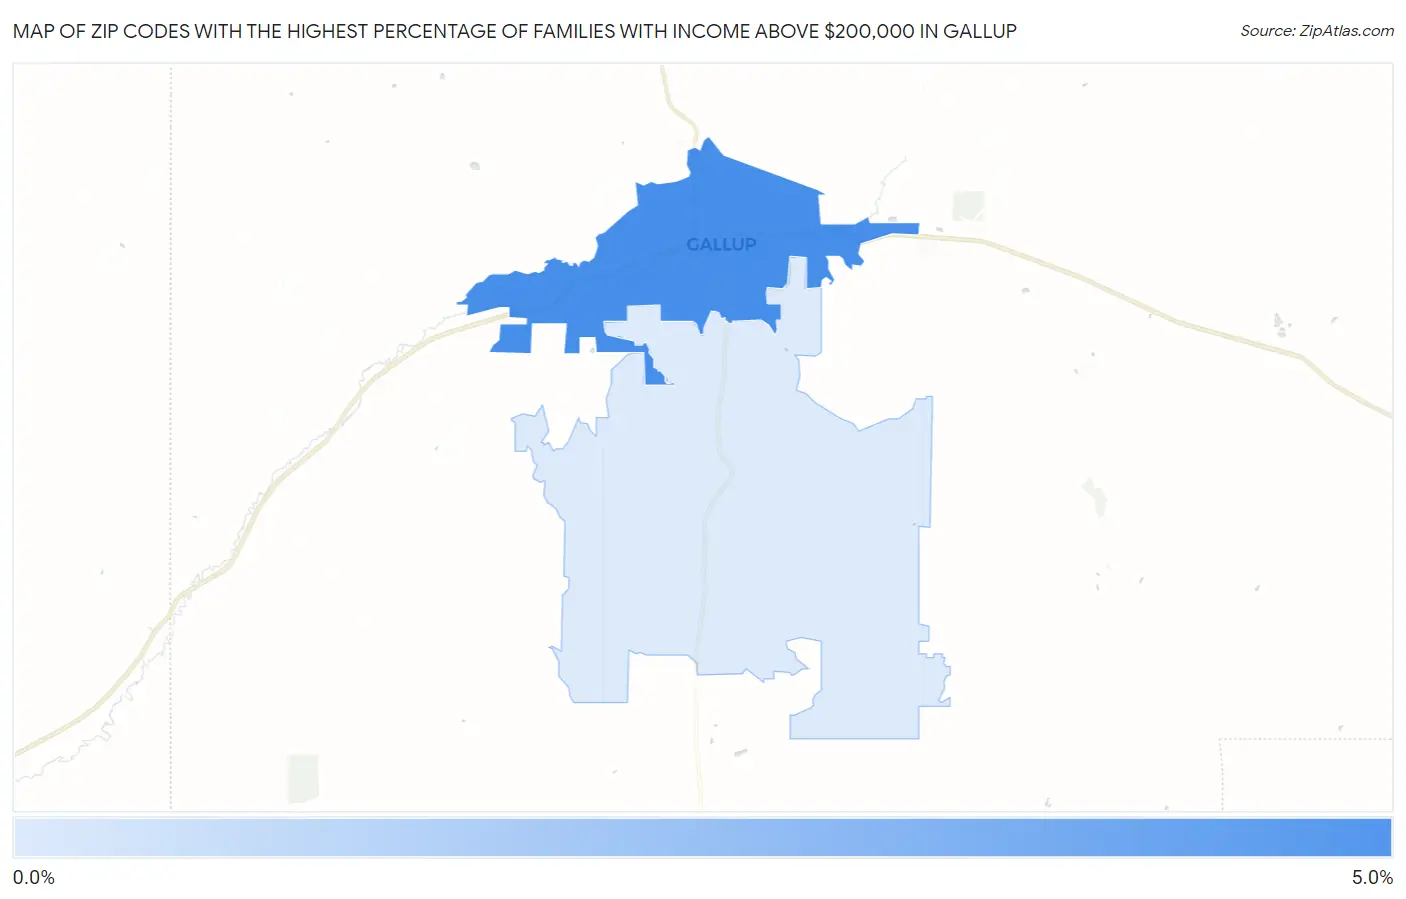
Map of Zip Codes with the Highest Percentage of Families with Income Above $200,000 in Gallup
0.80%
4.5%
Zip Codes with the Highest Percentage of Families with Income Above $200,000 in Gallup, NM
| Zip Code | Families with Income > $200k | vs State | vs National | |
| 1. | 87301 | 4.5% | 8.2%(-3.70)#109 | 14.8%(-10.3)#19,392 |
| 2. | 87305 | 0.80% | 8.2%(-7.40)#184 | 14.8%(-14.0)#26,394 |
1
Common Questions
What are the Top Zip Codes with the Highest Percentage of Families with Income Above $200,000 in Gallup, NM?
Top Zip Codes with the Highest Percentage of Families with Income Above $200,000 in Gallup, NM are:
What zip code has the Highest Percentage of Families with Income Above $200,000 in Gallup, NM?
87301 has the Highest Percentage of Families with Income Above $200,000 in Gallup, NM with 4.5%.
What is the Percentage of Families with Income Above $200,000 in Gallup, NM?
Percentage of Families with Income Above $200,000 in Gallup is 4.6%.
What is the Percentage of Families with Income Above $200,000 in New Mexico?
Percentage of Families with Income Above $200,000 in New Mexico is 8.2%.
What is the Percentage of Families with Income Above $200,000 in the United States?
Percentage of Families with Income Above $200,000 in the United States is 14.8%.