Zip Codes with the Highest Percentage of Households Without a Vehicle in Gallup, NM
RELATED REPORTS & OPTIONS
Households without a Cars
Gallup
Compare Zip Codes
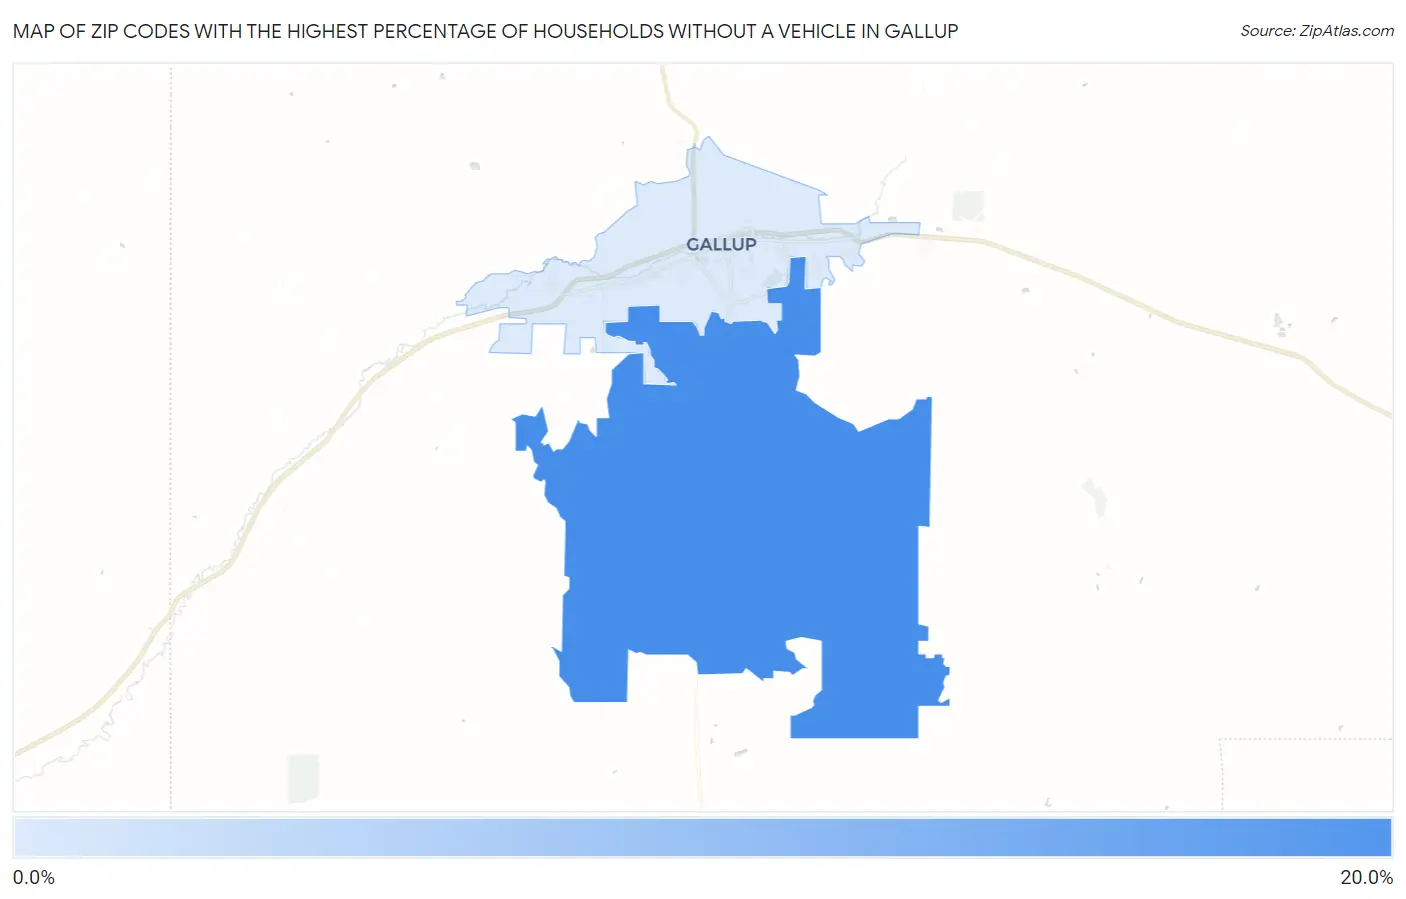
Map of Zip Codes with the Highest Percentage of Households Without a Vehicle in Gallup
8.7%
15.7%
Zip Codes with the Highest Percentage of Households Without a Vehicle in Gallup, NM
| Zip Code | Housholds Without a Car | vs State | vs National | |
| 1. | 87305 | 15.7% | 5.8%(+9.90)#31 | 8.3%(+7.40)#2,223 |
| 2. | 87301 | 8.7% | 5.8%(+2.90)#72 | 8.3%(+0.400)#6,077 |
1
Common Questions
What are the Top Zip Codes with the Highest Percentage of Households Without a Vehicle in Gallup, NM?
Top Zip Codes with the Highest Percentage of Households Without a Vehicle in Gallup, NM are:
What zip code has the Highest Percentage of Households Without a Vehicle in Gallup, NM?
87305 has the Highest Percentage of Households Without a Vehicle in Gallup, NM with 15.7%.
What is the Percentage of Households Without a Vehicle in Gallup, NM?
Percentage of Households Without a Vehicle in Gallup is 8.9%.
What is the Percentage of Households Without a Vehicle in New Mexico?
Percentage of Households Without a Vehicle in New Mexico is 5.8%.
What is the Percentage of Households Without a Vehicle in the United States?
Percentage of Households Without a Vehicle in the United States is 8.3%.