Zip Codes with the Highest Percentage of Population Employed in Legal Services & Support in Gallup, NM
RELATED REPORTS & OPTIONS
Legal Services & Support
Gallup
Compare Zip Codes
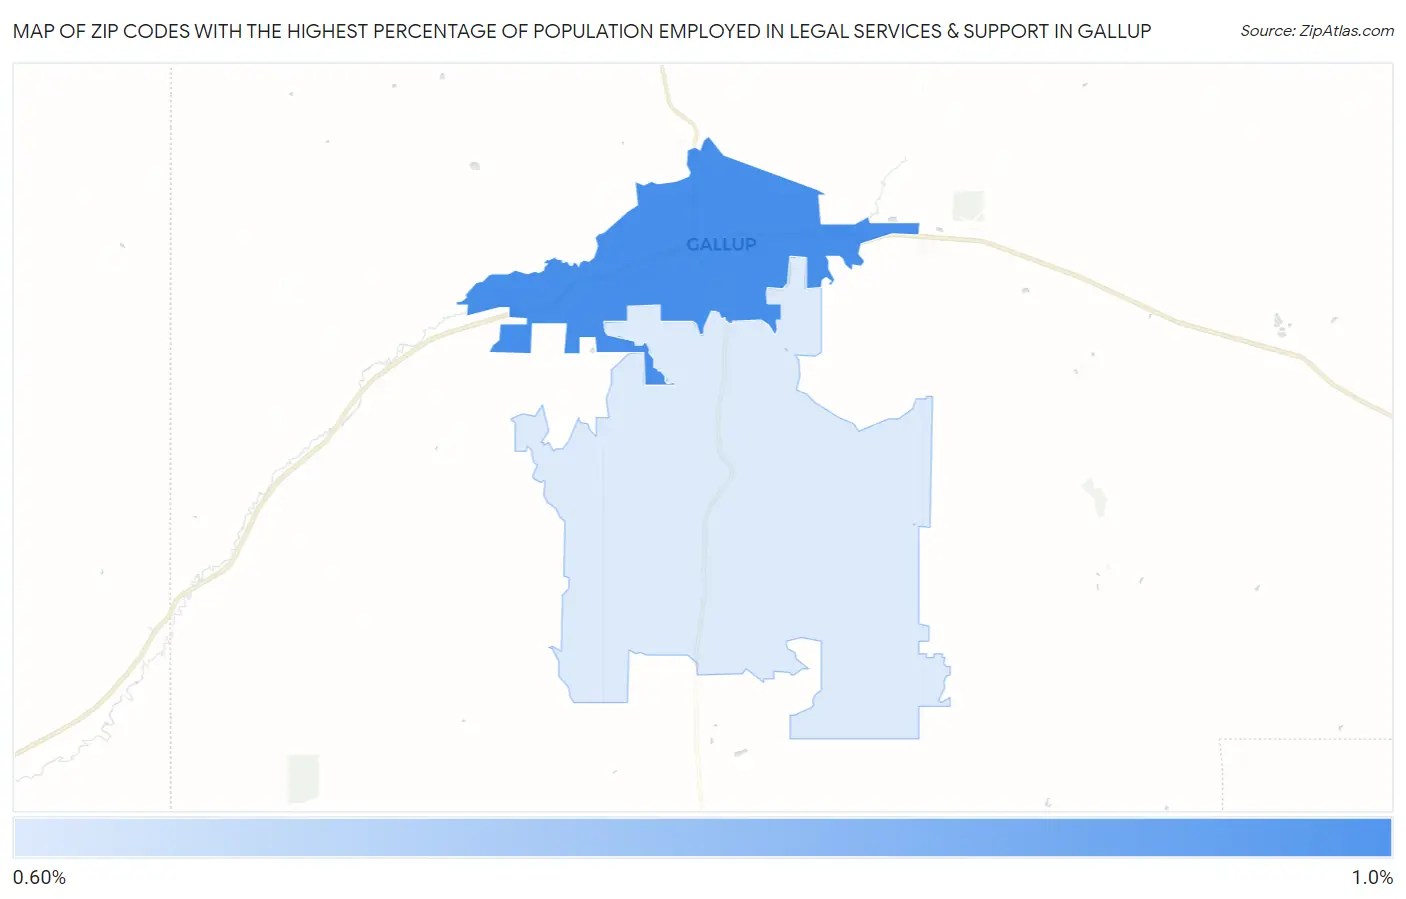
Map of Zip Codes with the Highest Percentage of Population Employed in Legal Services & Support in Gallup
0.62%
0.89%
Zip Codes with the Highest Percentage of Population Employed in Legal Services & Support in Gallup, NM
| Zip Code | % Employed | vs State | vs National | |
| 1. | 87301 | 0.89% | 1.3%(-0.421)#74 | 1.2%(-0.294)#8,703 |
| 2. | 87305 | 0.62% | 1.3%(-0.691)#79 | 1.2%(-0.565)#11,255 |
1
Common Questions
What are the Top Zip Codes with the Highest Percentage of Population Employed in Legal Services & Support in Gallup, NM?
Top Zip Codes with the Highest Percentage of Population Employed in Legal Services & Support in Gallup, NM are:
What zip code has the Highest Percentage of Population Employed in Legal Services & Support in Gallup, NM?
87301 has the Highest Percentage of Population Employed in Legal Services & Support in Gallup, NM with 0.89%.
What is the Percentage of Population Employed in Legal Services & Support in Gallup, NM?
Percentage of Population Employed in Legal Services & Support in Gallup is 0.92%.
What is the Percentage of Population Employed in Legal Services & Support in New Mexico?
Percentage of Population Employed in Legal Services & Support in New Mexico is 1.3%.
What is the Percentage of Population Employed in Legal Services & Support in the United States?
Percentage of Population Employed in Legal Services & Support in the United States is 1.2%.