Zip Codes with the Highest Percentage of Population with a Degree in Psychology in Gallup, NM
RELATED REPORTS & OPTIONS
Psychology
Gallup
Compare Zip Codes
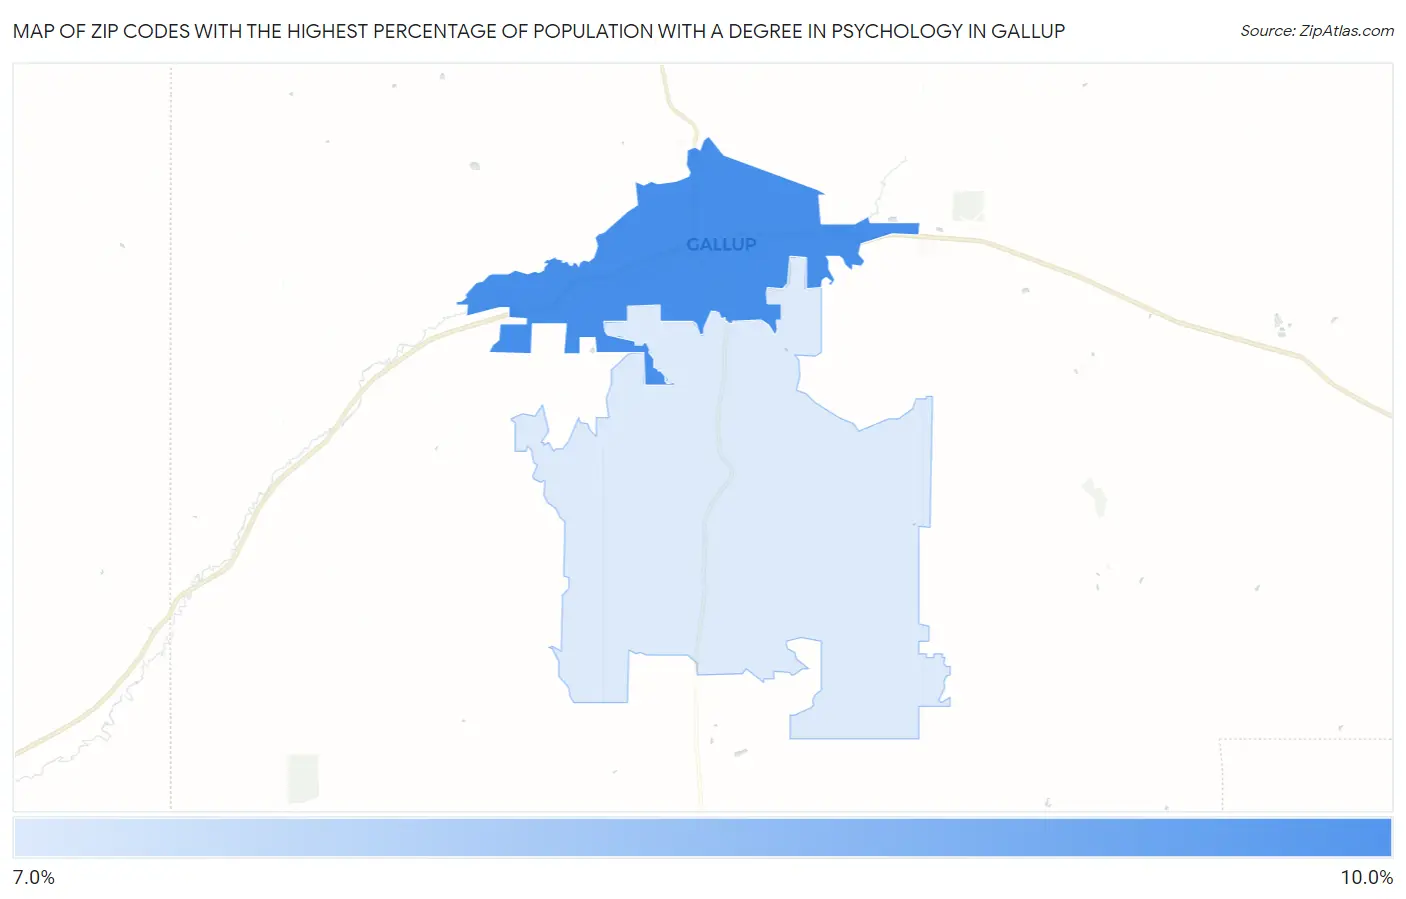
Map of Zip Codes with the Highest Percentage of Population with a Degree in Psychology in Gallup
7.3%
8.3%
Zip Codes with the Highest Percentage of Population with a Degree in Psychology in Gallup, NM
| Zip Code | % Graduates | vs State | vs National | |
| 1. | 87301 | 8.3% | 5.6%(+2.75)#47 | 5.1%(+3.29)#3,758 |
| 2. | 87305 | 7.3% | 5.6%(+1.70)#60 | 5.1%(+2.24)#5,139 |
1
Common Questions
What are the Top Zip Codes with the Highest Percentage of Population with a Degree in Psychology in Gallup, NM?
Top Zip Codes with the Highest Percentage of Population with a Degree in Psychology in Gallup, NM are:
What zip code has the Highest Percentage of Population with a Degree in Psychology in Gallup, NM?
87301 has the Highest Percentage of Population with a Degree in Psychology in Gallup, NM with 8.3%.
What is the Percentage of Population with a Degree in Psychology in Gallup, NM?
Percentage of Population with a Degree in Psychology in Gallup is 8.4%.
What is the Percentage of Population with a Degree in Psychology in New Mexico?
Percentage of Population with a Degree in Psychology in New Mexico is 5.6%.
What is the Percentage of Population with a Degree in Psychology in the United States?
Percentage of Population with a Degree in Psychology in the United States is 5.1%.