Zip Codes with the Highest Percentage of Population with a Degree in Visual and Performing Arts in Gallup, NM
RELATED REPORTS & OPTIONS
Visual and Performing Arts
Gallup
Compare Zip Codes
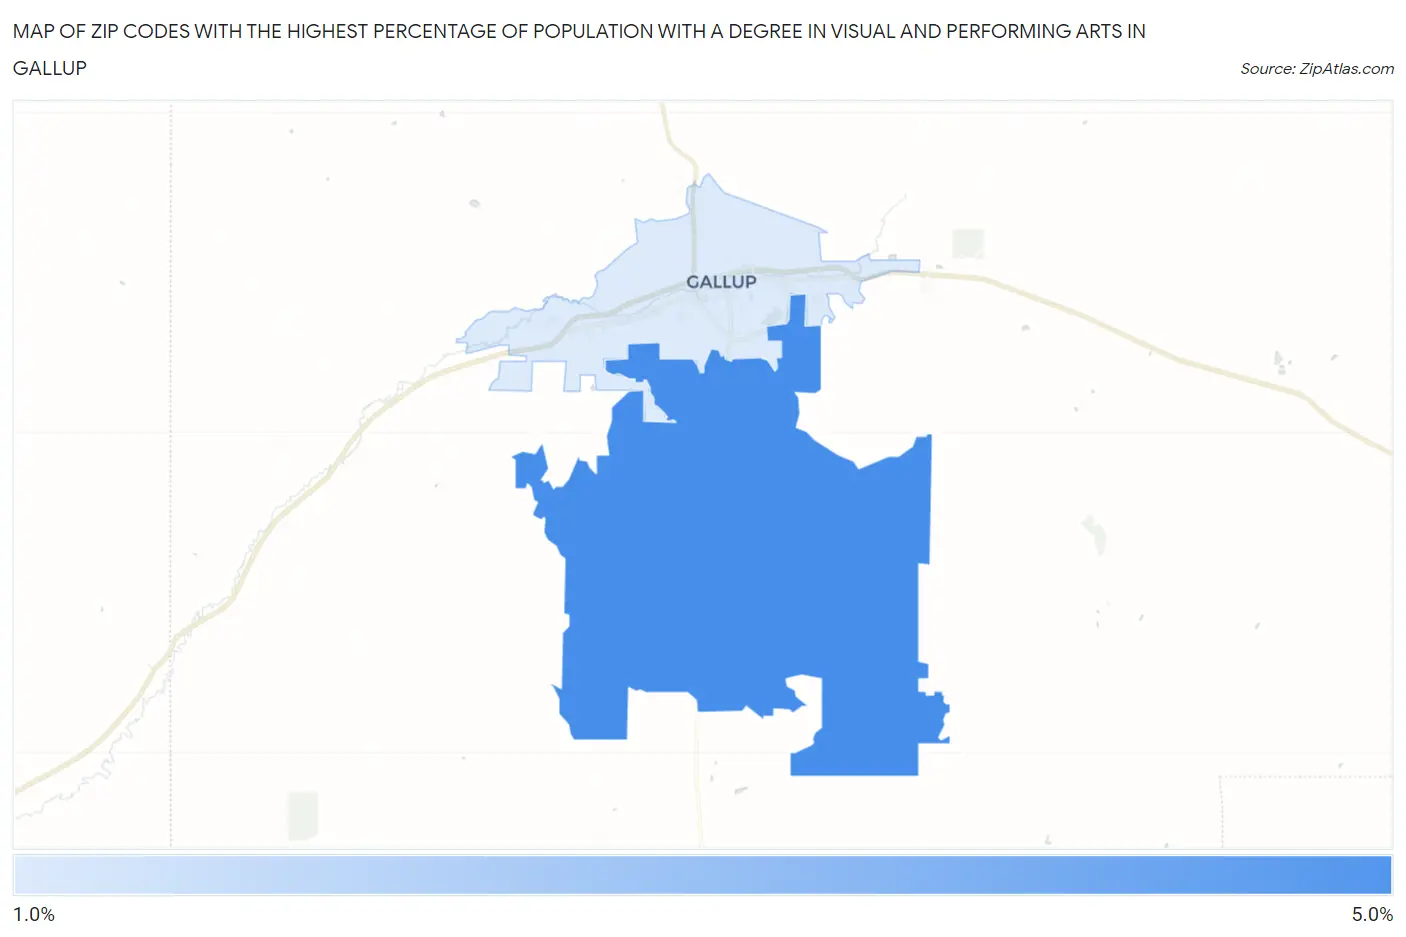
Map of Zip Codes with the Highest Percentage of Population with a Degree in Visual and Performing Arts in Gallup
1.5%
4.2%
Zip Codes with the Highest Percentage of Population with a Degree in Visual and Performing Arts in Gallup, NM
| Zip Code | % Graduates | vs State | vs National | |
| 1. | 87305 | 4.2% | 4.8%(-0.584)#81 | 4.3%(-0.085)#8,728 |
| 2. | 87301 | 1.5% | 4.8%(-3.27)#126 | 4.3%(-2.77)#18,224 |
1
Common Questions
What are the Top Zip Codes with the Highest Percentage of Population with a Degree in Visual and Performing Arts in Gallup, NM?
Top Zip Codes with the Highest Percentage of Population with a Degree in Visual and Performing Arts in Gallup, NM are:
What zip code has the Highest Percentage of Population with a Degree in Visual and Performing Arts in Gallup, NM?
87305 has the Highest Percentage of Population with a Degree in Visual and Performing Arts in Gallup, NM with 4.2%.
What is the Percentage of Population with a Degree in Visual and Performing Arts in Gallup, NM?
Percentage of Population with a Degree in Visual and Performing Arts in Gallup is 1.5%.
What is the Percentage of Population with a Degree in Visual and Performing Arts in New Mexico?
Percentage of Population with a Degree in Visual and Performing Arts in New Mexico is 4.8%.
What is the Percentage of Population with a Degree in Visual and Performing Arts in the United States?
Percentage of Population with a Degree in Visual and Performing Arts in the United States is 4.3%.