Zip Codes with the Highest Percentage of Population Employed in Agriculture, Fishing & Hunting in Gallup, NM
RELATED REPORTS & OPTIONS
Agriculture, Fishing & Hunting
Gallup
Compare Zip Codes
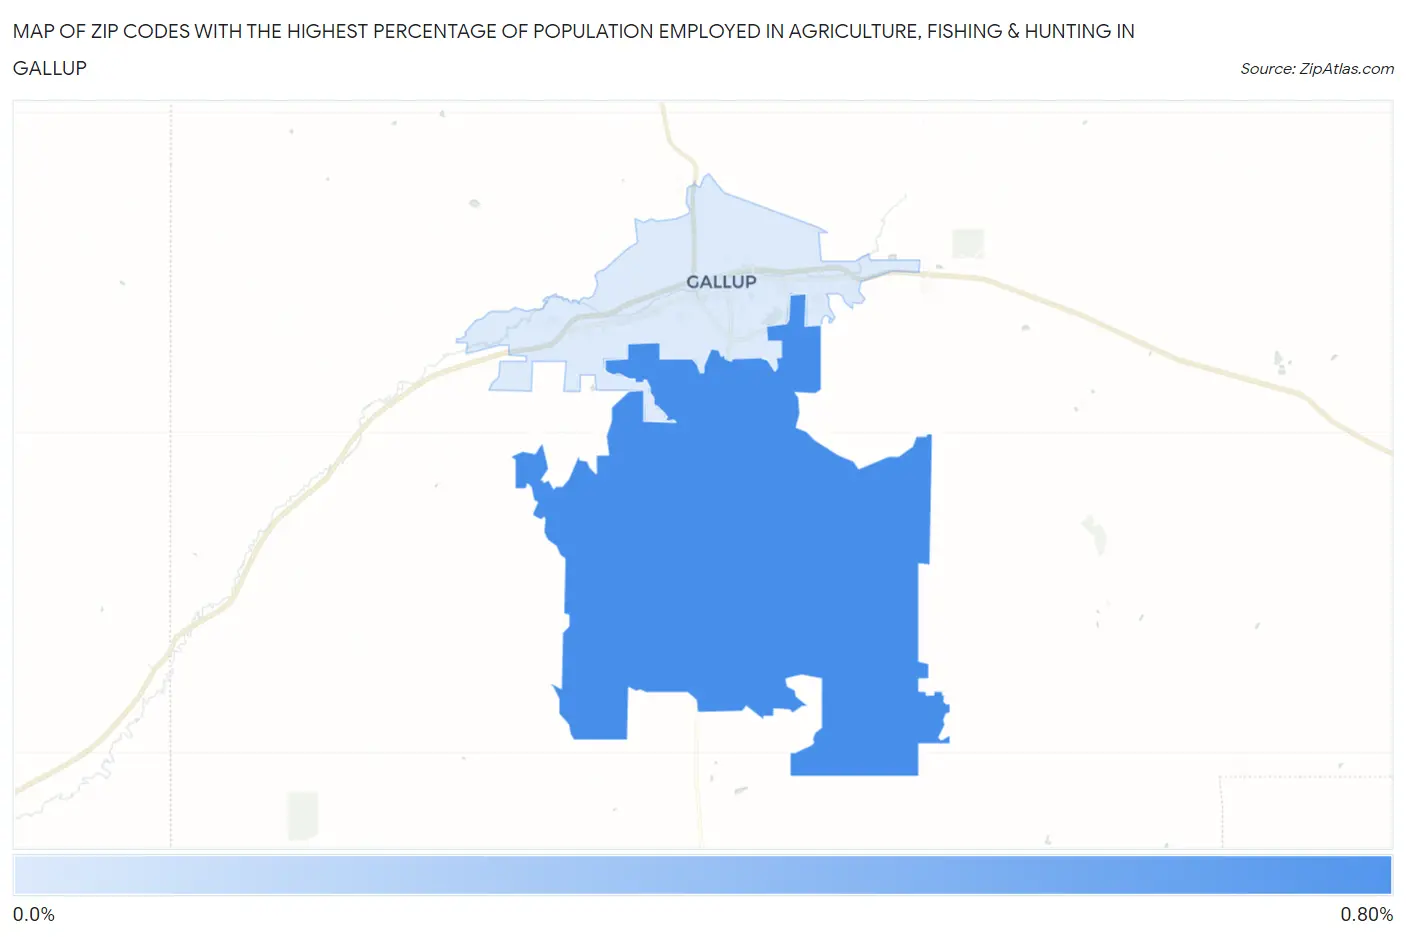
Map of Zip Codes with the Highest Percentage of Population Employed in Agriculture, Fishing & Hunting in Gallup
0.14%
0.62%
Zip Codes with the Highest Percentage of Population Employed in Agriculture, Fishing & Hunting in Gallup, NM
| Zip Code | % Employed | vs State | vs National | |
| 1. | 87305 | 0.62% | 2.0%(-1.34)#192 | 1.2%(-0.580)#18,354 |
| 2. | 87301 | 0.14% | 2.0%(-1.82)#213 | 1.2%(-1.06)#23,176 |
1
Common Questions
What are the Top Zip Codes with the Highest Percentage of Population Employed in Agriculture, Fishing & Hunting in Gallup, NM?
Top Zip Codes with the Highest Percentage of Population Employed in Agriculture, Fishing & Hunting in Gallup, NM are:
What zip code has the Highest Percentage of Population Employed in Agriculture, Fishing & Hunting in Gallup, NM?
87305 has the Highest Percentage of Population Employed in Agriculture, Fishing & Hunting in Gallup, NM with 0.62%.
What is the Percentage of Population Employed in Agriculture, Fishing & Hunting in Gallup, NM?
Percentage of Population Employed in Agriculture, Fishing & Hunting in Gallup is 0.14%.
What is the Percentage of Population Employed in Agriculture, Fishing & Hunting in New Mexico?
Percentage of Population Employed in Agriculture, Fishing & Hunting in New Mexico is 2.0%.
What is the Percentage of Population Employed in Agriculture, Fishing & Hunting in the United States?
Percentage of Population Employed in Agriculture, Fishing & Hunting in the United States is 1.2%.