Zip Codes with the Highest Percentage of Population Employed in Health Diagnosing & Treating in Toms River, NJ
RELATED REPORTS & OPTIONS
Health Diagnosing & Treating
Toms River
Compare Zip Codes
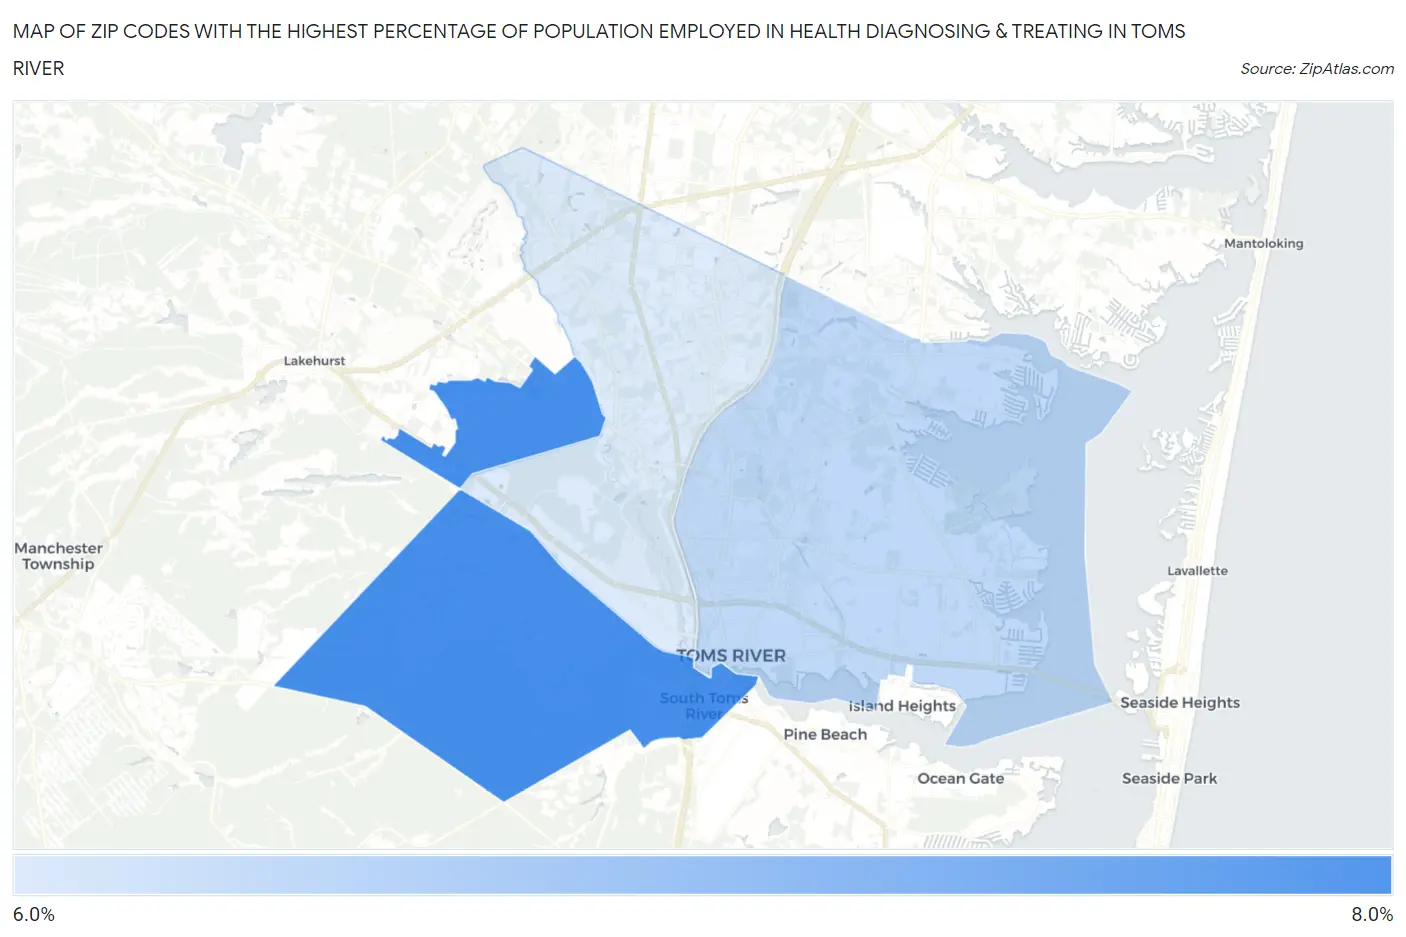
Map of Zip Codes with the Highest Percentage of Population Employed in Health Diagnosing & Treating in Toms River
6.2%
7.0%
Zip Codes with the Highest Percentage of Population Employed in Health Diagnosing & Treating in Toms River, NJ
| Zip Code | % Employed | vs State | vs National | |
| 1. | 08757 | 7.0% | 6.2%(+0.806)#208 | 6.2%(+0.803)#10,208 |
| 2. | 08753 | 6.4% | 6.2%(+0.120)#272 | 6.2%(+0.116)#12,532 |
| 3. | 08755 | 6.2% | 6.2%(-0.059)#292 | 6.2%(-0.063)#13,225 |
1
Common Questions
What are the Top Zip Codes with the Highest Percentage of Population Employed in Health Diagnosing & Treating in Toms River, NJ?
Top Zip Codes with the Highest Percentage of Population Employed in Health Diagnosing & Treating in Toms River, NJ are:
What zip code has the Highest Percentage of Population Employed in Health Diagnosing & Treating in Toms River, NJ?
08757 has the Highest Percentage of Population Employed in Health Diagnosing & Treating in Toms River, NJ with 7.0%.
What is the Percentage of Population Employed in Health Diagnosing & Treating in Toms River, NJ?
Percentage of Population Employed in Health Diagnosing & Treating in Toms River is 6.3%.
What is the Percentage of Population Employed in Health Diagnosing & Treating in New Jersey?
Percentage of Population Employed in Health Diagnosing & Treating in New Jersey is 6.2%.
What is the Percentage of Population Employed in Health Diagnosing & Treating in the United States?
Percentage of Population Employed in Health Diagnosing & Treating in the United States is 6.2%.