Zip Codes with the Highest Percentage of Population Employed in Architecture & Engineering in Greenville, NC
RELATED REPORTS & OPTIONS
Architecture & Engineering
Greenville
Compare Zip Codes
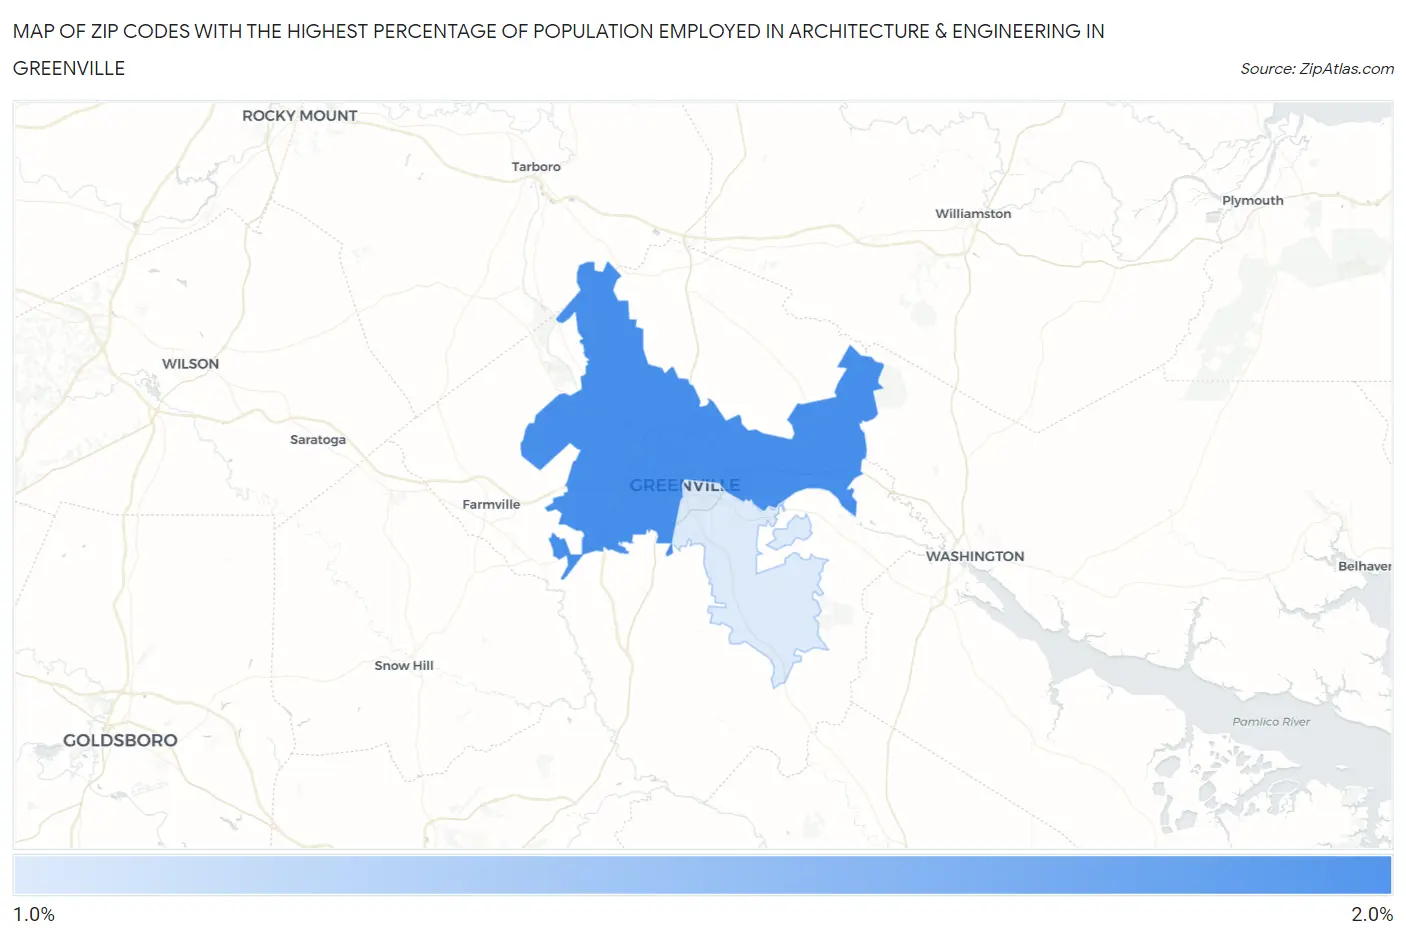
Map of Zip Codes with the Highest Percentage of Population Employed in Architecture & Engineering in Greenville
1.8%
2.0%
Zip Codes with the Highest Percentage of Population Employed in Architecture & Engineering in Greenville, NC
| Zip Code | % Employed | vs State | vs National | |
| 1. | 27834 | 2.0% | 1.9%(+0.110)#211 | 2.1%(-0.150)#9,614 |
| 2. | 27858 | 1.8% | 1.9%(-0.058)#238 | 2.1%(-0.319)#10,658 |
1
Common Questions
What are the Top Zip Codes with the Highest Percentage of Population Employed in Architecture & Engineering in Greenville, NC?
Top Zip Codes with the Highest Percentage of Population Employed in Architecture & Engineering in Greenville, NC are:
What zip code has the Highest Percentage of Population Employed in Architecture & Engineering in Greenville, NC?
27834 has the Highest Percentage of Population Employed in Architecture & Engineering in Greenville, NC with 2.0%.
What is the Percentage of Population Employed in Architecture & Engineering in Greenville, NC?
Percentage of Population Employed in Architecture & Engineering in Greenville is 1.6%.
What is the Percentage of Population Employed in Architecture & Engineering in North Carolina?
Percentage of Population Employed in Architecture & Engineering in North Carolina is 1.9%.
What is the Percentage of Population Employed in Architecture & Engineering in the United States?
Percentage of Population Employed in Architecture & Engineering in the United States is 2.1%.