Zip Codes with the Highest Percentage of Population Employed in Accommodation & Food Services in Chapel Hill, NC
RELATED REPORTS & OPTIONS
Accommodation & Food Services
Chapel Hill
Compare Zip Codes
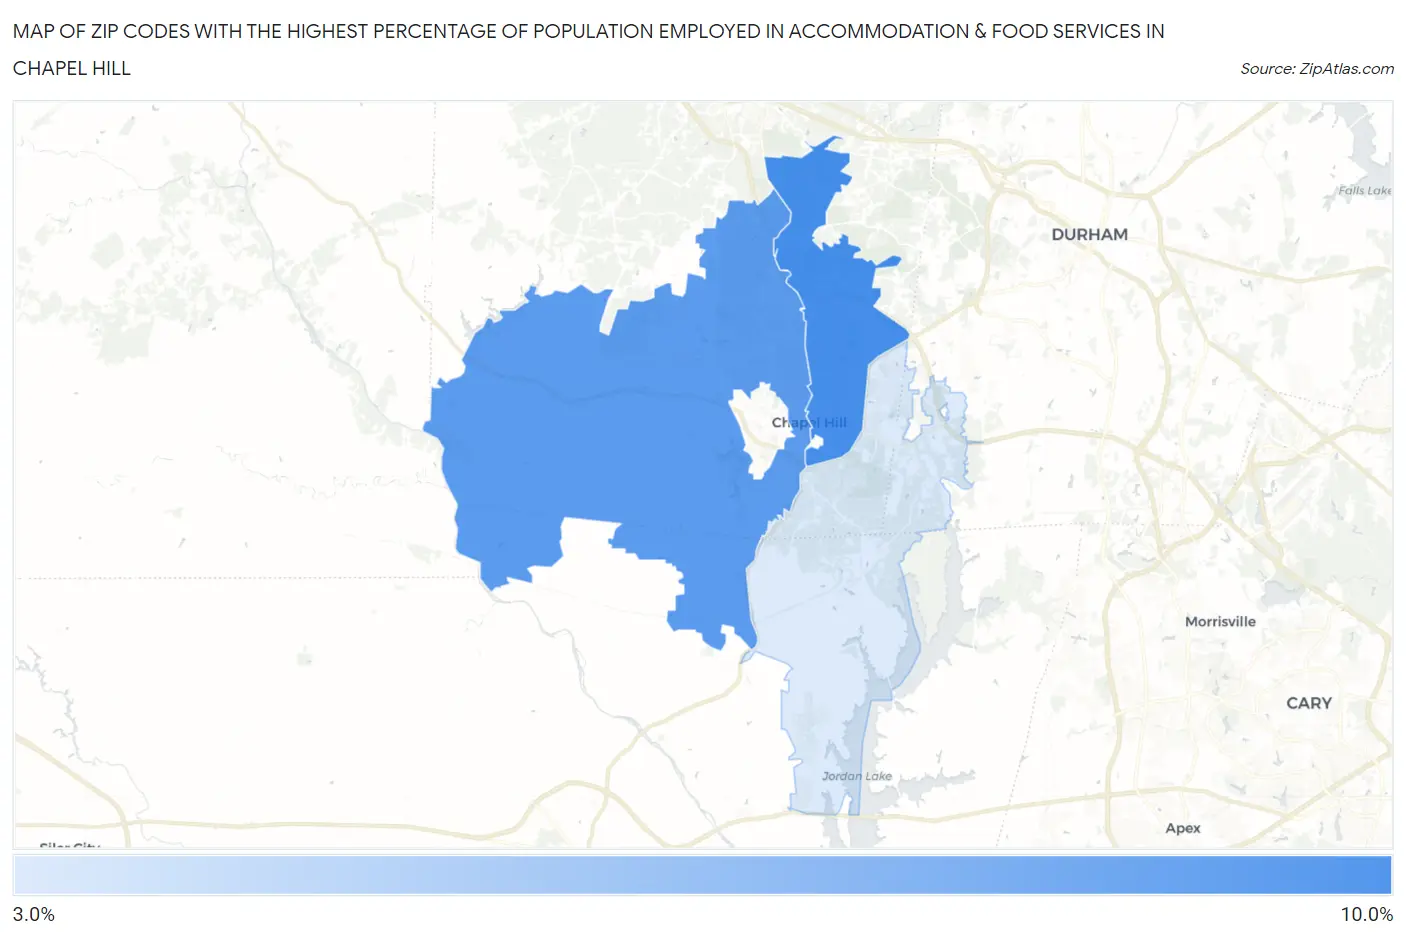
Map of Zip Codes with the Highest Percentage of Population Employed in Accommodation & Food Services in Chapel Hill
4.0%
8.9%
Zip Codes with the Highest Percentage of Population Employed in Accommodation & Food Services in Chapel Hill, NC
| Zip Code | % Employed | vs State | vs National | |
| 1. | 27514 | 8.9% | 7.0%(+1.88)#191 | 6.9%(+2.05)#6,081 |
| 2. | 27516 | 8.3% | 7.0%(+1.24)#221 | 6.9%(+1.41)#7,240 |
| 3. | 27517 | 4.0% | 7.0%(-3.06)#586 | 6.9%(-2.89)#20,195 |
1
Common Questions
What are the Top Zip Codes with the Highest Percentage of Population Employed in Accommodation & Food Services in Chapel Hill, NC?
Top Zip Codes with the Highest Percentage of Population Employed in Accommodation & Food Services in Chapel Hill, NC are:
What zip code has the Highest Percentage of Population Employed in Accommodation & Food Services in Chapel Hill, NC?
27514 has the Highest Percentage of Population Employed in Accommodation & Food Services in Chapel Hill, NC with 8.9%.
What is the Percentage of Population Employed in Accommodation & Food Services in Chapel Hill, NC?
Percentage of Population Employed in Accommodation & Food Services in Chapel Hill is 8.4%.
What is the Percentage of Population Employed in Accommodation & Food Services in North Carolina?
Percentage of Population Employed in Accommodation & Food Services in North Carolina is 7.0%.
What is the Percentage of Population Employed in Accommodation & Food Services in the United States?
Percentage of Population Employed in Accommodation & Food Services in the United States is 6.9%.