Zip Codes with the Lowest Poverty Level Among Seniors Over the Age of 75 in Saint Paul, MN

RELATED REPORTS & OPTIONS

Lowest Poverty | Seniors 75+
Population
Families and Households
Female Fertility
Female Fertility (Unmarried)
Race (Community Size)
Race (Percentage)
Ancestry (Community Size)
AfghanAfricanAlbanianAlsatianAmericanApacheArabArgentineanArmenianAustralianAustrianBahamianBangladeshiBarbadianBelgianBelizeanBhutaneseBlackfeetBrazilianBritishBritish West IndianBulgarianBurmeseCambodianCanadianCarpatho RusynCelticCentral AmericanCentral American IndianCherokeeChickasawChileanChippewaChoctawColombianCosta RicanCreeCroatianCubanCzechCzechoslovakianDanishDominicanDutchEastern EuropeanEcuadorianEgyptianEnglishEstonianEthiopianEuropeanFilipinoFinnishFrenchFrench American IndianFrench CanadianGermanGerman RussianGhanaianGreekGuamanian / ChamorroGuatemalanGuyaneseHaitianHonduranHopiHungarianIcelanderIndian (Asian)IndonesianInupiatIranianIraqiIrishIroquoisIsraeliItalianJamaicanJapaneseJordanianKenyanKoreanLaotianLatvianLebaneseLiberianLithuanianLuxembourgerMacedonianMalaysianMalteseMenomineeMexicanMexican American IndianMongolianMoroccanNative HawaiianNavajoNew ZealanderNicaraguanNigerianNorthern EuropeanNorwegianPakistaniPalestinianPanamanianParaguayanPennsylvania GermanPeruvianPolishPortuguesePotawatomiPuerto RicanPuget Sound SalishRomanianRussianSalvadoranSamoanScandinavianScotch-IrishScottishSeminoleSerbianSiouxSlavicSlovakSloveneSomaliSouth AfricanSouth AmericanSouth American IndianSpaniardSpanishSpanish AmericanSri LankanSubsaharan AfricanSudaneseSwedishSwissSyrianThaiTrinidadian and TobagonianTurkishU.S. Virgin IslanderUgandanUkrainianUruguayanVenezuelanVietnameseWelshWest IndianYugoslavianZimbabwean
Ancestry (Percentage)
AfghanAfricanAlbanianAlsatianAmericanApacheArabArgentineanArmenianAustralianAustrianBahamianBangladeshiBarbadianBelgianBelizeanBhutaneseBlackfeetBrazilianBritishBritish West IndianBulgarianBurmeseCambodianCanadianCarpatho RusynCelticCentral AmericanCentral American IndianCherokeeChickasawChileanChippewaChoctawColombianCosta RicanCreeCroatianCubanCzechCzechoslovakianDanishDominicanDutchEastern EuropeanEcuadorianEgyptianEnglishEstonianEthiopianEuropeanFilipinoFinnishFrenchFrench American IndianFrench CanadianGermanGerman RussianGhanaianGreekGuamanian / ChamorroGuatemalanGuyaneseHaitianHonduranHopiHungarianIcelanderIndian (Asian)IndonesianInupiatIranianIraqiIrishIroquoisIsraeliItalianJamaicanJapaneseJordanianKenyanKoreanLaotianLatvianLebaneseLiberianLithuanianLuxembourgerMacedonianMalaysianMalteseMenomineeMexicanMexican American IndianMongolianMoroccanNative HawaiianNavajoNew ZealanderNicaraguanNigerianNorthern EuropeanNorwegianPakistaniPalestinianPanamanianParaguayanPennsylvania GermanPeruvianPolishPortuguesePotawatomiPuerto RicanPuget Sound SalishRomanianRussianSalvadoranSamoanScandinavianScotch-IrishScottishSeminoleSerbianSiouxSlavicSlovakSloveneSomaliSouth AfricanSouth AmericanSouth American IndianSpaniardSpanishSpanish AmericanSri LankanSubsaharan AfricanSudaneseSwedishSwissSyrianThaiTrinidadian and TobagonianTurkishU.S. Virgin IslanderUgandanUkrainianUruguayanVenezuelanVietnameseWelshWest IndianYugoslavianZimbabwean
Immigrant Origin (Total)
AfghanistanAfricaArgentinaArmeniaAsiaAustraliaAustriaBahamasBangladeshBarbadosBelarusBelgiumBelizeBoliviaBosnia and HerzegovinaBrazilBulgariaBurma / MyanmarCambodiaCameroonCanadaCaribbeanCentral AmericaChileChinaColombiaCongoCosta RicaCroatiaCubaCzechoslovakiaDenmarkDominican RepublicEastern AfricaEastern AsiaEastern EuropeEcuadorEgyptEl SalvadorEnglandEritreaEthiopiaEuropeFranceGermanyGhanaGreeceGuatemalaGuyanaHaitiHondurasHong KongHungaryIndiaIndonesiaIranIraqIrelandIsraelItalyJamaicaJapanJordanKazakhstanKenyaKoreaKuwaitLaosLatin AmericaLatviaLebanonLiberiaMalaysiaMexicoMiddle AfricaMoldovaMoroccoNepalNetherlandsNicaraguaNigeriaNorth MacedoniaNorthern AfricaNorthern EuropeNorwayOceaniaPakistanPanamaPeruPhilippinesPolandPortugalRomaniaRussiaSaudi ArabiaScotlandSerbiaSierra LeoneSingaporeSomaliaSouth AfricaSouth AmericaSouth Central AsiaSouth Eastern AsiaSouthern EuropeSpainSri LankaSudanSwedenSwitzerlandTaiwanThailandTrinidad and TobagoTurkeyUgandaUkraineUruguayVenezuelaVietnamWestern AfricaWestern AsiaWestern EuropeYemenZaireZimbabwe
Immigrant Origin (Percentage)
AfghanistanAfricaArgentinaArmeniaAsiaAustraliaAustriaBahamasBangladeshBarbadosBelarusBelgiumBelizeBoliviaBosnia and HerzegovinaBrazilBulgariaBurma / MyanmarCambodiaCameroonCanadaCaribbeanCentral AmericaChileChinaColombiaCongoCosta RicaCroatiaCubaCzechoslovakiaDenmarkDominican RepublicEastern AfricaEastern AsiaEastern EuropeEcuadorEgyptEl SalvadorEnglandEritreaEthiopiaEuropeFranceGermanyGhanaGreeceGuatemalaGuyanaHaitiHondurasHong KongHungaryIndiaIndonesiaIranIraqIrelandIsraelItalyJamaicaJapanJordanKazakhstanKenyaKoreaKuwaitLaosLatin AmericaLatviaLebanonLiberiaMalaysiaMexicoMiddle AfricaMoldovaMoroccoNepalNetherlandsNicaraguaNigeriaNorth MacedoniaNorthern AfricaNorthern EuropeNorwayOceaniaPakistanPanamaPeruPhilippinesPolandPortugalRomaniaRussiaSaudi ArabiaScotlandSerbiaSierra LeoneSingaporeSomaliaSouth AfricaSouth AmericaSouth Central AsiaSouth Eastern AsiaSouthern EuropeSpainSri LankaSudanSwedenSwitzerlandTaiwanThailandTrinidad and TobagoTurkeyUgandaUkraineUruguayVenezuelaVietnamWestern AfricaWestern AsiaWestern EuropeYemenZaireZimbabwe
Income
Income (Families)
Income (Households)
Poverty
Poverty (Families)
Unemployment
Employment Occupations
Employment Industries
Employer Class
Commute Time
Commute Means
School Enrollment
Education by Degree Field
Occupancy
Finances
Physical Characteristics
Saint Paul
Compare Zip Codes
Comparison Subject

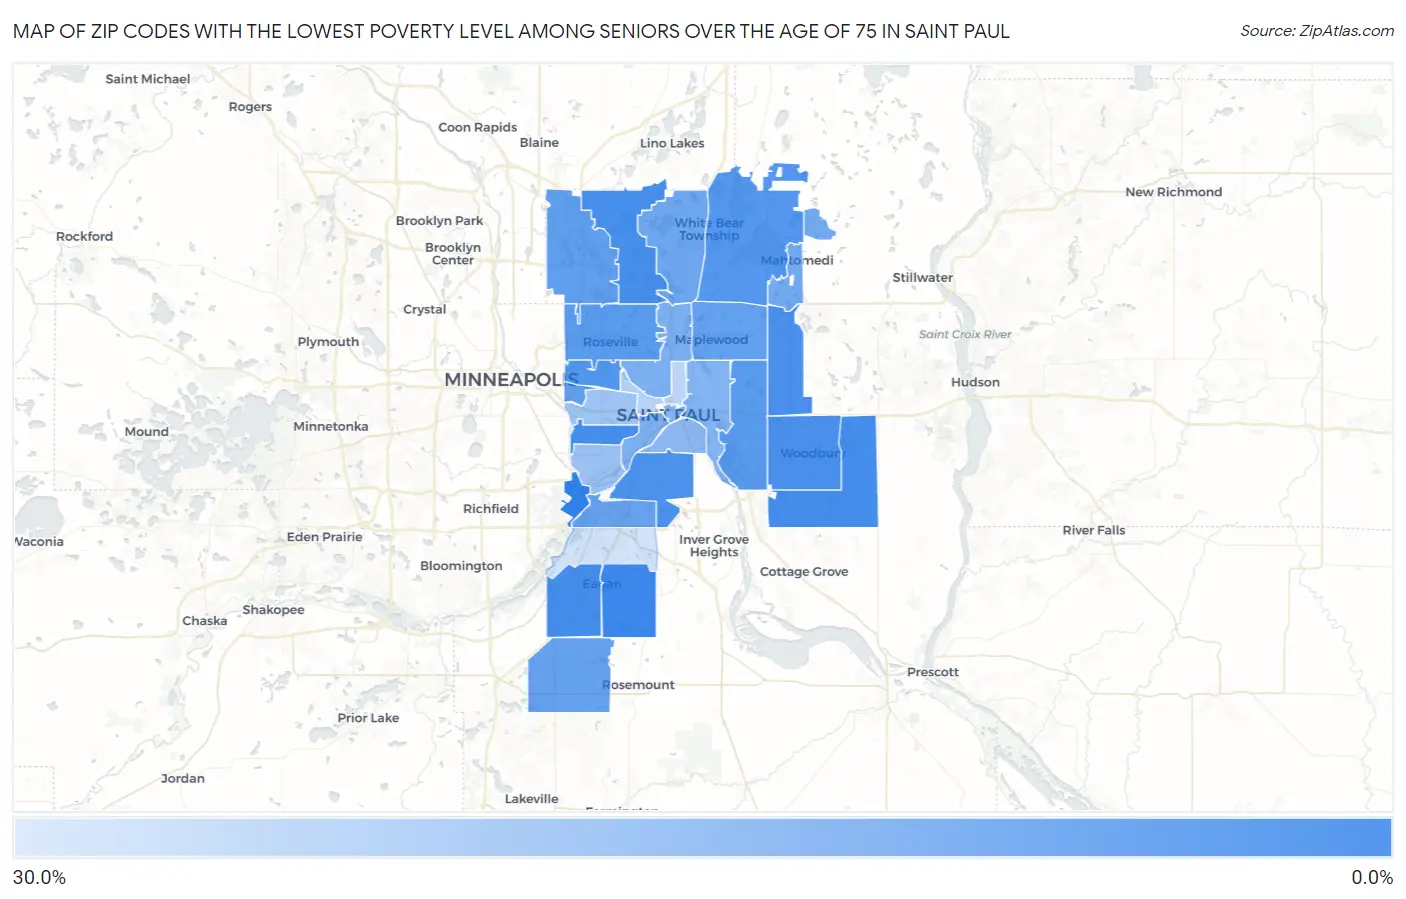
Map of Zip Codes with the Lowest Poverty Level Among Seniors Over the Age of 75 in Saint Paul

30.0%
0.0%
Zip Codes with the Lowest Poverty Level Among Seniors Over the Age of 75 in Saint Paul Map

Zip Codes with the Lowest Poverty Level Among Seniors Over the Age of 75 in Saint Paul, MN

Zip Code Senior Poverty vs State vs National
1.551232.0%9.5%(-7.46)#2911.1%(-9.03)#956
2.551293.5%9.5%(-5.99)#7811.1%(-7.57)#2,386
3.551223.6%9.5%(-5.93)#8311.1%(-7.51)#2,456
4.551053.7%9.5%(-5.77)#9311.1%(-7.34)#2,684
5.551264.0%9.5%(-5.50)#11011.1%(-7.08)#3,040
6.551254.2%9.5%(-5.25)#12111.1%(-6.83)#3,378
7.551284.3%9.5%(-5.18)#12411.1%(-6.76)#3,471
8.551184.7%9.5%(-4.77)#14211.1%(-6.34)#4,054
9.551086.0%9.5%(-3.45)#20111.1%(-5.03)#6,032
10.551106.4%9.5%(-3.13)#21611.1%(-4.71)#6,524
11.551196.9%9.5%(-2.58)#24511.1%(-4.15)#7,375
12.551137.2%9.5%(-2.28)#25511.1%(-3.86)#7,817
13.551128.3%9.5%(-1.22)#30611.1%(-2.79)#9,406
14.551148.3%9.5%(-1.16)#30911.1%(-2.73)#9,485
15.551098.6%9.5%(-0.941)#32011.1%(-2.51)#9,820
16.551248.9%9.5%(-0.559)#33911.1%(-2.13)#10,329
17.551209.2%9.5%(-0.275)#35611.1%(-1.85)#10,717
18.5512710.7%9.5%(+1.16)#41911.1%(-0.417)#12,680
19.5511511.3%9.5%(+1.76)#44511.1%(+0.183)#13,380
20.5510213.4%9.5%(+3.88)#53411.1%(+2.31)#15,683
21.5511713.6%9.5%(+4.11)#54511.1%(+2.53)#15,886
22.5510613.7%9.5%(+4.23)#54811.1%(+2.66)#16,017
23.5510114.7%9.5%(+5.22)#57911.1%(+3.65)#16,868
24.5510715.9%9.5%(+6.39)#60711.1%(+4.82)#17,705
25.5511618.7%9.5%(+9.23)#65111.1%(+7.65)#19,413
26.5510419.5%9.5%(+10.0)#66511.1%(+8.47)#19,816
27.5510324.2%9.5%(+14.7)#71411.1%(+13.1)#21,457
28.5513025.7%9.5%(+16.2)#72311.1%(+14.6)#21,842
29.5512129.6%9.5%(+20.1)#73911.1%(+18.5)#22,598

Common Questions

What are the Top 10 Zip Codes with the Lowest Poverty Level Among Seniors Over the Age of 75 in Saint Paul, MN?
Top 10 Zip Codes with the Lowest Poverty Level Among Seniors Over the Age of 75 in Saint Paul, MN are:
#1
0.0%
#2
2.0%
#3
3.5%
#4
3.6%
#5
3.7%
#6
4.0%
#7
4.2%
#8
4.3%
#9
4.7%
#10
6.0%
What zip code has the Lowest Poverty Level Among Seniors Over the Age of 75 in Saint Paul, MN?
55123 has the Lowest Poverty Level Among Seniors Over the Age of 75 in Saint Paul, MN with 2.0%.
What is the Poverty Level Among Seniors Over the Age of 75 in Minnesota?
Poverty Level Among Seniors Over the Age of 75 in Minnesota is 9.5%.
What is the Poverty Level Among Seniors Over the Age of 75 in the United States?
Poverty Level Among Seniors Over the Age of 75 in the United States is 11.1%.