Zip Codes with the Highest Percentage of Population Employed in Office & Administration in Saint Paul, MN
RELATED REPORTS & OPTIONS
Office & Administration
Saint Paul
Compare Zip Codes
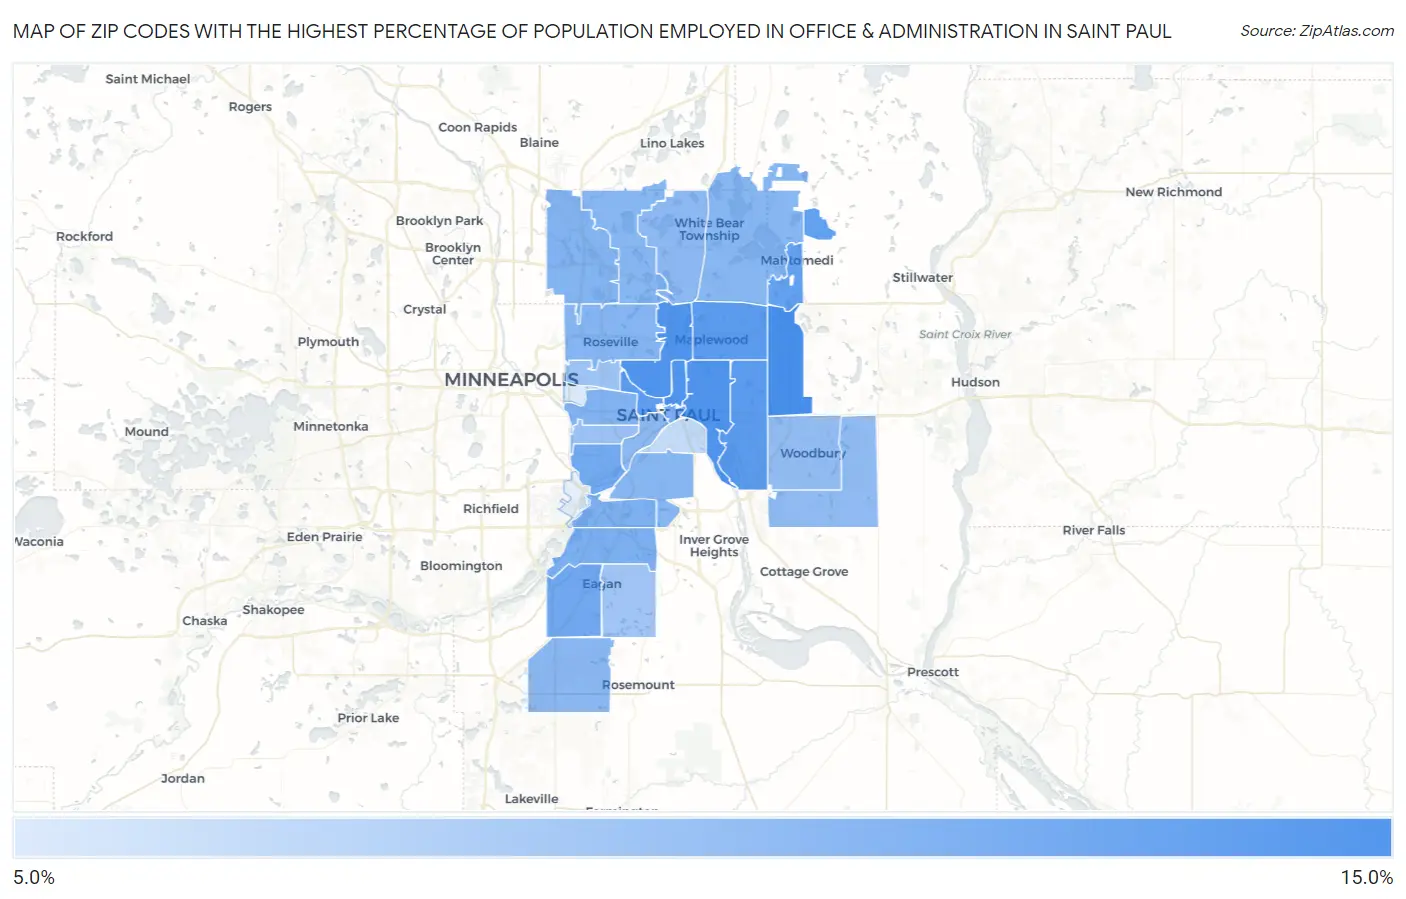
Map of Zip Codes with the Highest Percentage of Population Employed in Office & Administration in Saint Paul
5.3%
13.8%
Zip Codes with the Highest Percentage of Population Employed in Office & Administration in Saint Paul, MN
| Zip Code | % Employed | vs State | vs National | |
| 1. | 55128 | 13.8% | 10.3%(+3.49)#114 | 10.9%(+2.94)#6,387 |
| 2. | 55130 | 13.3% | 10.3%(+3.02)#142 | 10.9%(+2.47)#7,320 |
| 3. | 55117 | 13.3% | 10.3%(+2.99)#143 | 10.9%(+2.44)#7,384 |
| 4. | 55106 | 13.3% | 10.3%(+2.98)#145 | 10.9%(+2.42)#7,418 |
| 5. | 55119 | 12.7% | 10.3%(+2.41)#187 | 10.9%(+1.86)#8,750 |
| 6. | 55109 | 12.6% | 10.3%(+2.30)#195 | 10.9%(+1.74)#9,043 |
| 7. | 55103 | 12.5% | 10.3%(+2.18)#202 | 10.9%(+1.63)#9,344 |
| 8. | 55115 | 12.1% | 10.3%(+1.82)#232 | 10.9%(+1.26)#10,380 |
| 9. | 55122 | 11.4% | 10.3%(+1.08)#302 | 10.9%(+0.528)#12,611 |
| 10. | 55116 | 11.2% | 10.3%(+0.907)#320 | 10.9%(+0.354)#13,175 |
| 11. | 55101 | 10.8% | 10.3%(+0.524)#361 | 10.9%(-0.029)#14,431 |
| 12. | 55121 | 10.7% | 10.3%(+0.368)#376 | 10.9%(-0.185)#14,902 |
| 13. | 55120 | 10.6% | 10.3%(+0.334)#382 | 10.9%(-0.220)#15,012 |
| 14. | 55104 | 10.5% | 10.3%(+0.191)#407 | 10.9%(-0.362)#15,504 |
| 15. | 55112 | 10.4% | 10.3%(+0.063)#421 | 10.9%(-0.490)#15,944 |
| 16. | 55113 | 10.1% | 10.3%(-0.171)#454 | 10.9%(-0.725)#16,697 |
| 17. | 55110 | 10.1% | 10.3%(-0.197)#457 | 10.9%(-0.751)#16,780 |
| 18. | 55126 | 10.0% | 10.3%(-0.299)#469 | 10.9%(-0.853)#17,107 |
| 19. | 55118 | 10.0% | 10.3%(-0.301)#470 | 10.9%(-0.854)#17,115 |
| 20. | 55124 | 9.9% | 10.3%(-0.362)#481 | 10.9%(-0.915)#17,308 |
| 21. | 55102 | 9.8% | 10.3%(-0.493)#496 | 10.9%(-1.05)#17,728 |
| 22. | 55127 | 9.8% | 10.3%(-0.515)#501 | 10.9%(-1.07)#17,796 |
| 23. | 55129 | 9.5% | 10.3%(-0.798)#542 | 10.9%(-1.35)#18,734 |
| 24. | 55125 | 9.4% | 10.3%(-0.872)#556 | 10.9%(-1.43)#18,969 |
| 25. | 55105 | 9.0% | 10.3%(-1.32)#592 | 10.9%(-1.87)#20,305 |
| 26. | 55108 | 8.7% | 10.3%(-1.58)#624 | 10.9%(-2.13)#21,090 |
| 27. | 55123 | 8.6% | 10.3%(-1.71)#633 | 10.9%(-2.27)#21,458 |
| 28. | 55107 | 6.6% | 10.3%(-3.66)#773 | 10.9%(-4.22)#25,845 |
| 29. | 55114 | 5.3% | 10.3%(-5.00)#827 | 10.9%(-5.55)#27,788 |
1
Common Questions
What are the Top 10 Zip Codes with the Highest Percentage of Population Employed in Office & Administration in Saint Paul, MN?
Top 10 Zip Codes with the Highest Percentage of Population Employed in Office & Administration in Saint Paul, MN are:
What zip code has the Highest Percentage of Population Employed in Office & Administration in Saint Paul, MN?
55128 has the Highest Percentage of Population Employed in Office & Administration in Saint Paul, MN with 13.8%.
What is the Percentage of Population Employed in Office & Administration in Minnesota?
Percentage of Population Employed in Office & Administration in Minnesota is 10.3%.
What is the Percentage of Population Employed in Office & Administration in the United States?
Percentage of Population Employed in Office & Administration in the United States is 10.9%.