Zip Codes with the Highest Percentage of Population Employed in Professional & Scientific Services in Saint Paul, MN
RELATED REPORTS & OPTIONS
Professional & Scientific Services
Saint Paul
Compare Zip Codes
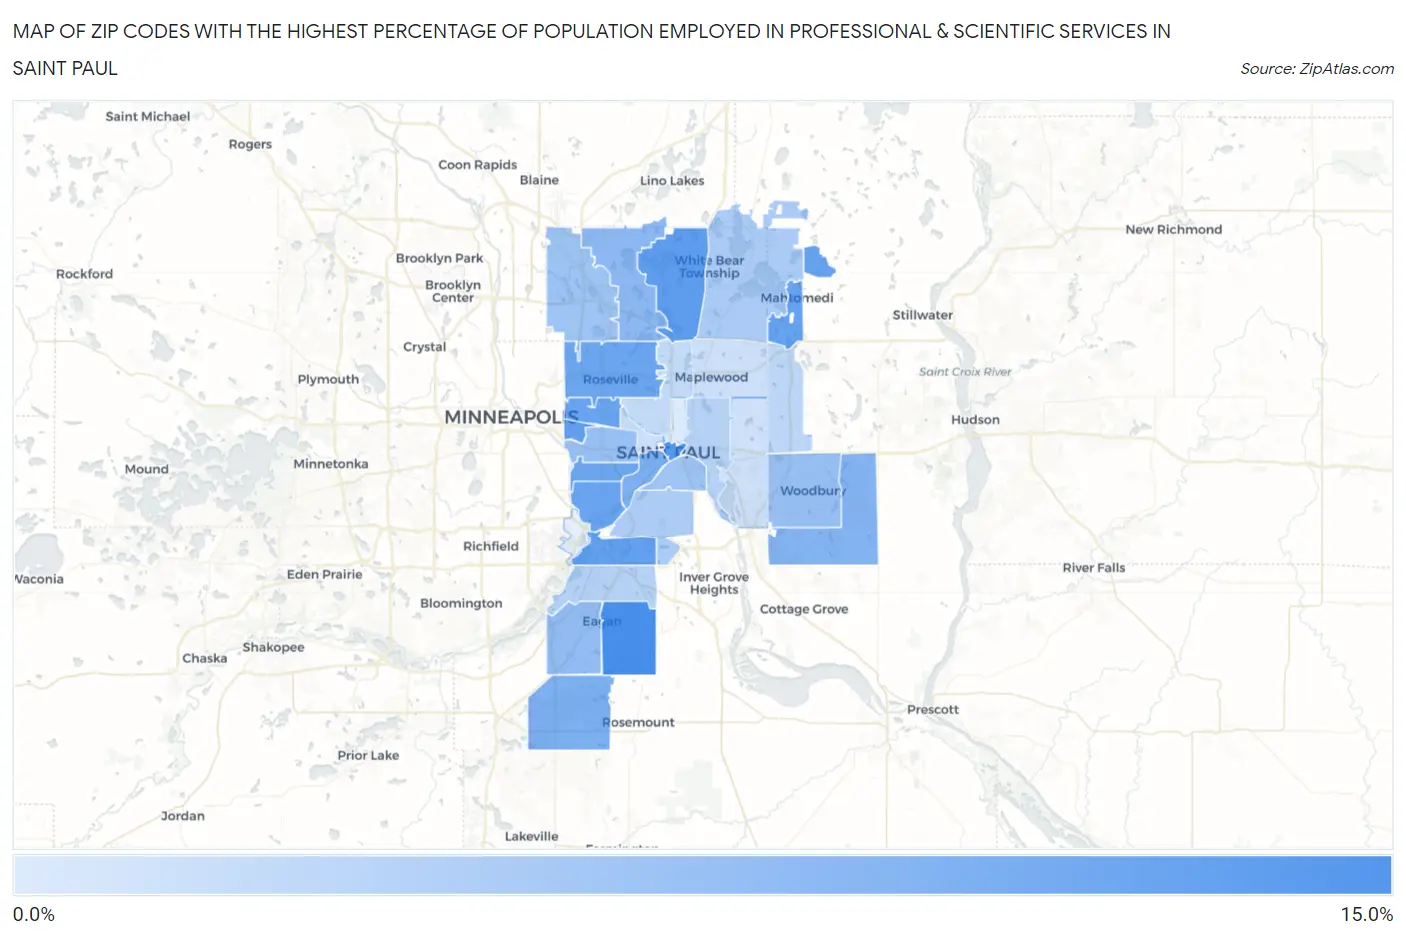
Map of Zip Codes with the Highest Percentage of Population Employed in Professional & Scientific Services in Saint Paul
3.9%
14.3%

Zip Codes with the Highest Percentage of Population Employed in Professional & Scientific Services in Saint Paul, MN
| Zip Code | % Employed | vs State | vs National | |
| 1. | 55123 | 14.3% | 7.1%(+7.25)#22 | 7.8%(+6.46)#2,155 |
| 2. | 55101 | 13.5% | 7.1%(+6.43)#28 | 7.8%(+5.64)#2,497 |
| 3. | 55127 | 12.6% | 7.1%(+5.57)#34 | 7.8%(+4.78)#2,877 |
| 4. | 55120 | 12.4% | 7.1%(+5.30)#39 | 7.8%(+4.50)#3,018 |
| 5. | 55114 | 12.2% | 7.1%(+5.17)#40 | 7.8%(+4.38)#3,077 |
| 6. | 55115 | 12.1% | 7.1%(+5.02)#42 | 7.8%(+4.23)#3,156 |
| 7. | 55116 | 11.9% | 7.1%(+4.80)#47 | 7.8%(+4.01)#3,299 |
| 8. | 55108 | 11.8% | 7.1%(+4.73)#48 | 7.8%(+3.94)#3,322 |
| 9. | 55105 | 11.7% | 7.1%(+4.62)#51 | 7.8%(+3.83)#3,398 |
| 10. | 55113 | 11.7% | 7.1%(+4.60)#52 | 7.8%(+3.81)#3,408 |
| 11. | 55102 | 10.5% | 7.1%(+3.49)#65 | 7.8%(+2.70)#4,147 |
| 12. | 55124 | 10.5% | 7.1%(+3.43)#67 | 7.8%(+2.64)#4,204 |
| 13. | 55129 | 10.0% | 7.1%(+2.91)#71 | 7.8%(+2.12)#4,604 |
| 14. | 55126 | 9.4% | 7.1%(+2.30)#82 | 7.8%(+1.51)#5,136 |
| 15. | 55122 | 9.0% | 7.1%(+1.97)#88 | 7.8%(+1.18)#5,493 |
| 16. | 55125 | 8.6% | 7.1%(+1.59)#93 | 7.8%(+0.795)#5,877 |
| 17. | 55104 | 8.5% | 7.1%(+1.45)#95 | 7.8%(+0.653)#6,026 |
| 18. | 55112 | 8.1% | 7.1%(+1.08)#100 | 7.8%(+0.288)#6,491 |
| 19. | 55107 | 8.1% | 7.1%(+1.07)#101 | 7.8%(+0.273)#6,507 |
| 20. | 55110 | 7.3% | 7.1%(+0.199)#126 | 7.8%(-0.594)#7,732 |
| 21. | 55118 | 7.1% | 7.1%(+0.059)#131 | 7.8%(-0.734)#7,973 |
| 22. | 55106 | 6.5% | 7.1%(-0.586)#153 | 7.8%(-1.38)#9,094 |
| 23. | 55121 | 6.5% | 7.1%(-0.587)#154 | 7.8%(-1.38)#9,098 |
| 24. | 55128 | 6.1% | 7.1%(-0.982)#175 | 7.8%(-1.77)#9,841 |
| 25. | 55117 | 5.6% | 7.1%(-1.42)#193 | 7.8%(-2.21)#10,740 |
| 26. | 55103 | 4.9% | 7.1%(-2.15)#239 | 7.8%(-2.94)#12,550 |
| 27. | 55109 | 4.9% | 7.1%(-2.15)#242 | 7.8%(-2.94)#12,563 |
| 28. | 55119 | 4.9% | 7.1%(-2.19)#246 | 7.8%(-2.98)#12,666 |
| 29. | 55130 | 3.9% | 7.1%(-3.17)#338 | 7.8%(-3.97)#15,472 |
1
Common Questions
What are the Top 10 Zip Codes with the Highest Percentage of Population Employed in Professional & Scientific Services in Saint Paul, MN?
Top 10 Zip Codes with the Highest Percentage of Population Employed in Professional & Scientific Services in Saint Paul, MN are:
What zip code has the Highest Percentage of Population Employed in Professional & Scientific Services in Saint Paul, MN?
55123 has the Highest Percentage of Population Employed in Professional & Scientific Services in Saint Paul, MN with 14.3%.
What is the Percentage of Population Employed in Professional & Scientific Services in Minnesota?
Percentage of Population Employed in Professional & Scientific Services in Minnesota is 7.1%.
What is the Percentage of Population Employed in Professional & Scientific Services in the United States?
Percentage of Population Employed in Professional & Scientific Services in the United States is 7.8%.