Zip Codes with the Highest Percentage of Population Employed in Transportation & Warehousing in Saint Paul, MN
RELATED REPORTS & OPTIONS
Transportation & Warehousing
Saint Paul
Compare Zip Codes
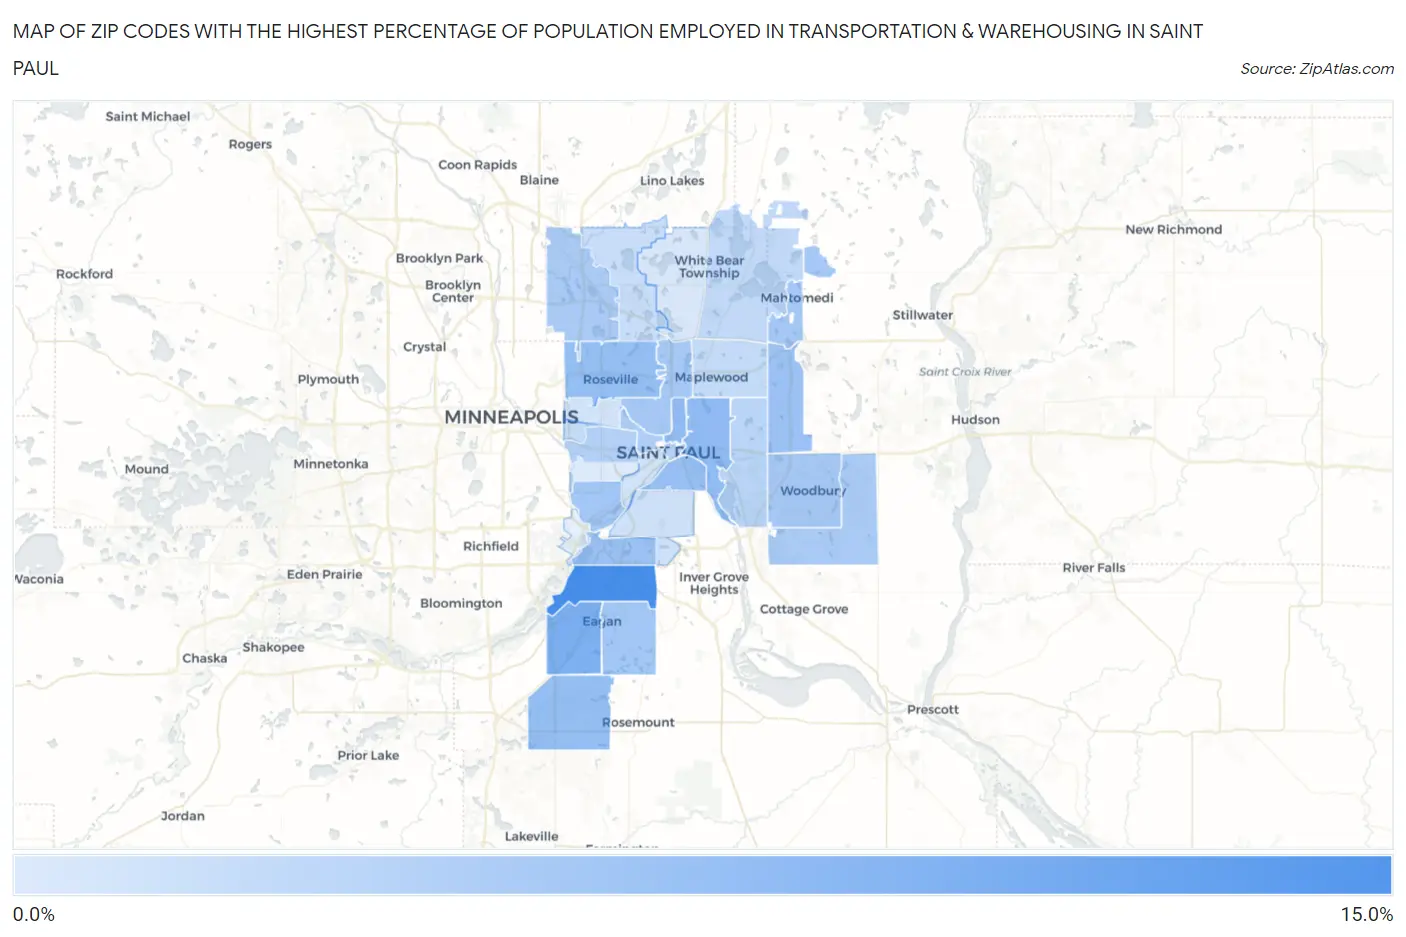
Map of Zip Codes with the Highest Percentage of Population Employed in Transportation & Warehousing in Saint Paul
1.7%
11.2%
Zip Codes with the Highest Percentage of Population Employed in Transportation & Warehousing in Saint Paul, MN
| Zip Code | % Employed | vs State | vs National | |
| 1. | 55121 | 11.2% | 4.2%(+7.00)#28 | 4.9%(+6.26)#2,228 |
| 2. | 55122 | 7.7% | 4.2%(+3.52)#98 | 4.9%(+2.78)#5,291 |
| 3. | 55130 | 6.4% | 4.2%(+2.20)#160 | 4.9%(+1.45)#7,815 |
| 4. | 55106 | 6.4% | 4.2%(+2.16)#161 | 4.9%(+1.42)#7,890 |
| 5. | 55113 | 6.2% | 4.2%(+1.96)#180 | 4.9%(+1.22)#8,378 |
| 6. | 55124 | 6.1% | 4.2%(+1.91)#184 | 4.9%(+1.17)#8,505 |
| 7. | 55107 | 6.0% | 4.2%(+1.76)#198 | 4.9%(+1.02)#8,878 |
| 8. | 55128 | 5.9% | 4.2%(+1.68)#208 | 4.9%(+0.932)#9,114 |
| 9. | 55120 | 5.7% | 4.2%(+1.47)#235 | 4.9%(+0.722)#9,760 |
| 10. | 55116 | 5.3% | 4.2%(+1.05)#274 | 4.9%(+0.309)#11,056 |
| 11. | 55123 | 5.2% | 4.2%(+1.03)#278 | 4.9%(+0.290)#11,108 |
| 12. | 55115 | 5.1% | 4.2%(+0.913)#288 | 4.9%(+0.170)#11,552 |
| 13. | 55125 | 5.0% | 4.2%(+0.841)#296 | 4.9%(+0.097)#11,803 |
| 14. | 55117 | 5.0% | 4.2%(+0.839)#297 | 4.9%(+0.096)#11,808 |
| 15. | 55129 | 4.9% | 4.2%(+0.671)#319 | 4.9%(-0.072)#12,368 |
| 16. | 55112 | 4.8% | 4.2%(+0.556)#335 | 4.9%(-0.187)#12,801 |
| 17. | 55103 | 4.3% | 4.2%(+0.129)#401 | 4.9%(-0.614)#14,467 |
| 18. | 55104 | 4.2% | 4.2%(+0.019)#422 | 4.9%(-0.724)#14,928 |
| 19. | 55101 | 4.1% | 4.2%(-0.098)#454 | 4.9%(-0.841)#15,442 |
| 20. | 55119 | 3.8% | 4.2%(-0.440)#512 | 4.9%(-1.18)#16,960 |
| 21. | 55110 | 3.4% | 4.2%(-0.758)#551 | 4.9%(-1.50)#18,317 |
| 22. | 55109 | 3.3% | 4.2%(-0.931)#585 | 4.9%(-1.67)#19,026 |
| 23. | 55114 | 3.1% | 4.2%(-1.12)#610 | 4.9%(-1.86)#19,870 |
| 24. | 55126 | 2.9% | 4.2%(-1.27)#632 | 4.9%(-2.01)#20,519 |
| 25. | 55118 | 2.6% | 4.2%(-1.63)#676 | 4.9%(-2.37)#22,095 |
| 26. | 55102 | 2.5% | 4.2%(-1.75)#696 | 4.9%(-2.49)#22,603 |
| 27. | 55108 | 2.3% | 4.2%(-1.91)#728 | 4.9%(-2.65)#23,221 |
| 28. | 55127 | 1.9% | 4.2%(-2.29)#769 | 4.9%(-3.03)#24,568 |
| 29. | 55105 | 1.7% | 4.2%(-2.50)#782 | 4.9%(-3.24)#25,265 |
1
Common Questions
What are the Top 10 Zip Codes with the Highest Percentage of Population Employed in Transportation & Warehousing in Saint Paul, MN?
Top 10 Zip Codes with the Highest Percentage of Population Employed in Transportation & Warehousing in Saint Paul, MN are:
What zip code has the Highest Percentage of Population Employed in Transportation & Warehousing in Saint Paul, MN?
55121 has the Highest Percentage of Population Employed in Transportation & Warehousing in Saint Paul, MN with 11.2%.
What is the Percentage of Population Employed in Transportation & Warehousing in Minnesota?
Percentage of Population Employed in Transportation & Warehousing in Minnesota is 4.2%.
What is the Percentage of Population Employed in Transportation & Warehousing in the United States?
Percentage of Population Employed in Transportation & Warehousing in the United States is 4.9%.