Zip Codes with the Highest Percentage of Population Employed in Accommodation & Food Services in Shreveport, LA
RELATED REPORTS & OPTIONS
Accommodation & Food Services
Shreveport
Compare Zip Codes
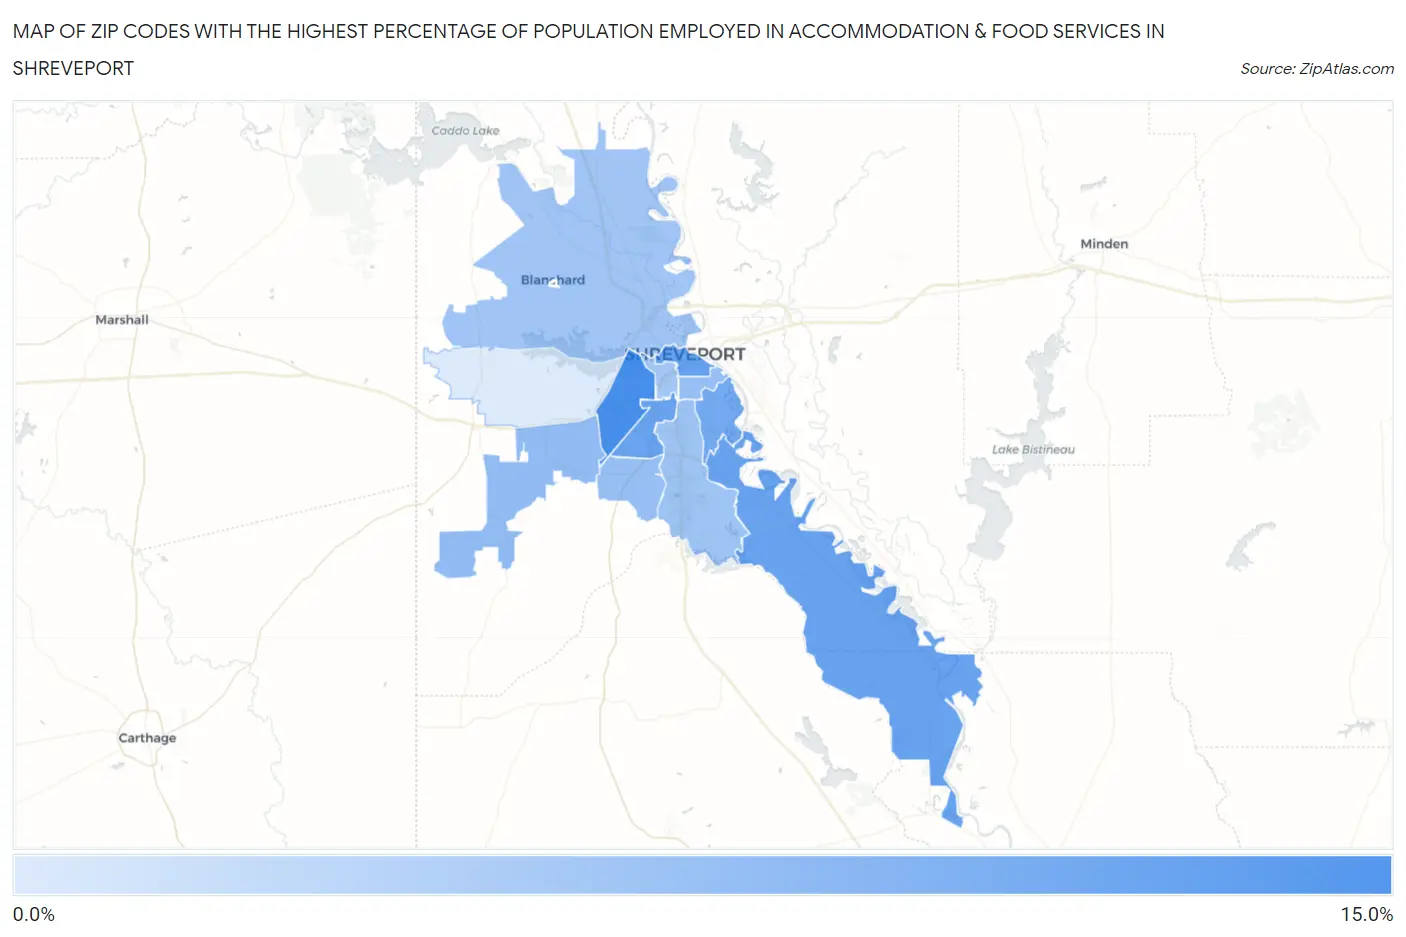
Map of Zip Codes with the Highest Percentage of Population Employed in Accommodation & Food Services in Shreveport
2.6%
12.4%
Zip Codes with the Highest Percentage of Population Employed in Accommodation & Food Services in Shreveport, LA
| Zip Code | % Employed | vs State | vs National | |
| 1. | 71109 | 12.4% | 7.6%(+4.78)#59 | 6.9%(+5.51)#2,638 |
| 2. | 71101 | 10.4% | 7.6%(+2.80)#83 | 6.9%(+3.53)#4,091 |
| 3. | 71115 | 10.3% | 7.6%(+2.66)#87 | 6.9%(+3.38)#4,232 |
| 4. | 71108 | 10.2% | 7.6%(+2.59)#88 | 6.9%(+3.32)#4,308 |
| 5. | 71105 | 9.5% | 7.6%(+1.85)#98 | 6.9%(+2.58)#5,262 |
| 6. | 71129 | 7.5% | 7.6%(-0.158)#160 | 6.9%(+0.571)#9,104 |
| 7. | 71118 | 7.0% | 7.6%(-0.652)#183 | 6.9%(+0.077)#10,451 |
| 8. | 71104 | 7.0% | 7.6%(-0.656)#184 | 6.9%(+0.073)#10,460 |
| 9. | 71106 | 6.6% | 7.6%(-1.06)#198 | 6.9%(-0.331)#11,677 |
| 10. | 71107 | 6.5% | 7.6%(-1.13)#201 | 6.9%(-0.396)#11,895 |
| 11. | 71103 | 6.3% | 7.6%(-1.27)#207 | 6.9%(-0.543)#12,357 |
| 12. | 71119 | 2.6% | 7.6%(-4.98)#352 | 6.9%(-4.25)#24,176 |
1
Common Questions
What are the Top 10 Zip Codes with the Highest Percentage of Population Employed in Accommodation & Food Services in Shreveport, LA?
Top 10 Zip Codes with the Highest Percentage of Population Employed in Accommodation & Food Services in Shreveport, LA are:
What zip code has the Highest Percentage of Population Employed in Accommodation & Food Services in Shreveport, LA?
71109 has the Highest Percentage of Population Employed in Accommodation & Food Services in Shreveport, LA with 12.4%.
What is the Percentage of Population Employed in Accommodation & Food Services in Shreveport, LA?
Percentage of Population Employed in Accommodation & Food Services in Shreveport is 8.6%.
What is the Percentage of Population Employed in Accommodation & Food Services in Louisiana?
Percentage of Population Employed in Accommodation & Food Services in Louisiana is 7.6%.
What is the Percentage of Population Employed in Accommodation & Food Services in the United States?
Percentage of Population Employed in Accommodation & Food Services in the United States is 6.9%.