Zip Codes with the Highest Percentage of Households Without a Vehicle in Shreveport, LA
RELATED REPORTS & OPTIONS
Households without a Cars
Shreveport
Compare Zip Codes
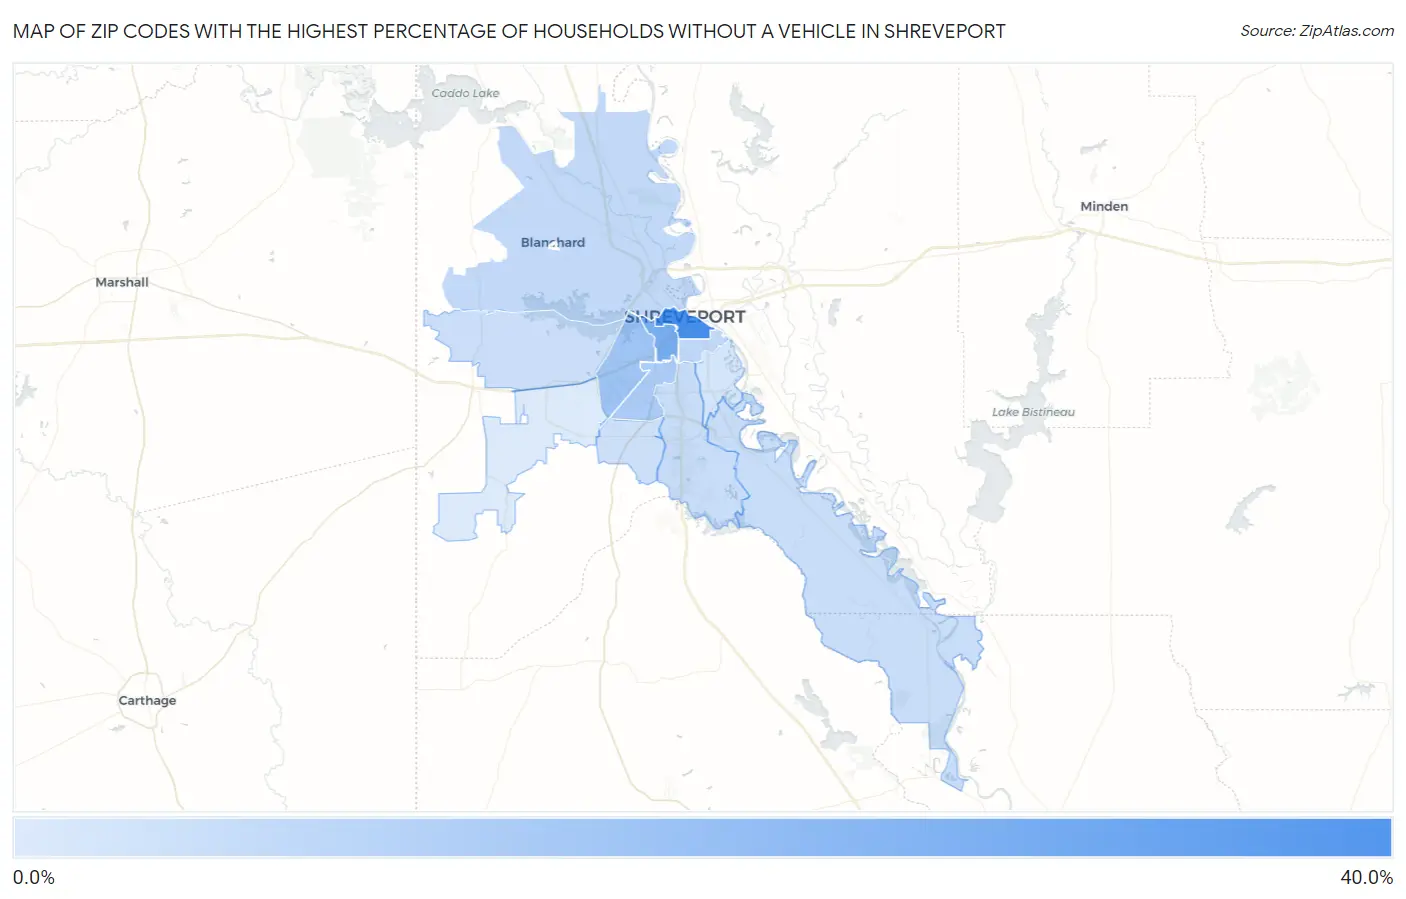
Map of Zip Codes with the Highest Percentage of Households Without a Vehicle in Shreveport
3.3%
40.0%
Zip Codes with the Highest Percentage of Households Without a Vehicle in Shreveport, LA
| Zip Code | Housholds Without a Car | vs State | vs National | |
| 1. | 71101 | 40.0% | 8.3%(+31.7)#2 | 8.3%(+31.7)#514 |
| 2. | 71103 | 26.9% | 8.3%(+18.6)#14 | 8.3%(+18.6)#949 |
| 3. | 71109 | 17.3% | 8.3%(+9.00)#47 | 8.3%(+9.00)#1,897 |
| 4. | 71108 | 14.3% | 8.3%(+6.00)#72 | 8.3%(+6.00)#2,592 |
| 5. | 71104 | 9.7% | 8.3%(+1.40)#138 | 8.3%(+1.40)#5,118 |
| 6. | 71107 | 9.3% | 8.3%(+1.00)#147 | 8.3%(+1.00)#5,428 |
| 7. | 71106 | 7.9% | 8.3%(-0.400)#187 | 8.3%(-0.400)#7,078 |
| 8. | 71115 | 7.7% | 8.3%(-0.600)#199 | 8.3%(-0.600)#7,410 |
| 9. | 71119 | 7.1% | 8.3%(-1.20)#218 | 8.3%(-1.20)#8,428 |
| 10. | 71118 | 6.7% | 8.3%(-1.60)#233 | 8.3%(-1.60)#9,028 |
| 11. | 71105 | 5.4% | 8.3%(-2.90)#273 | 8.3%(-2.90)#11,875 |
| 12. | 71129 | 3.3% | 8.3%(-5.00)#349 | 8.3%(-5.00)#18,055 |
1
Common Questions
What are the Top 10 Zip Codes with the Highest Percentage of Households Without a Vehicle in Shreveport, LA?
Top 10 Zip Codes with the Highest Percentage of Households Without a Vehicle in Shreveport, LA are:
What zip code has the Highest Percentage of Households Without a Vehicle in Shreveport, LA?
71101 has the Highest Percentage of Households Without a Vehicle in Shreveport, LA with 40.0%.
What is the Percentage of Households Without a Vehicle in Shreveport, LA?
Percentage of Households Without a Vehicle in Shreveport is 11.5%.
What is the Percentage of Households Without a Vehicle in Louisiana?
Percentage of Households Without a Vehicle in Louisiana is 8.3%.
What is the Percentage of Households Without a Vehicle in the United States?
Percentage of Households Without a Vehicle in the United States is 8.3%.