Zip Codes with the Highest Percentage of Population Taking Taxi / Cab to Work in Shreveport, LA
RELATED REPORTS & OPTIONS
Taxi / Cab
Shreveport
Compare Zip Codes
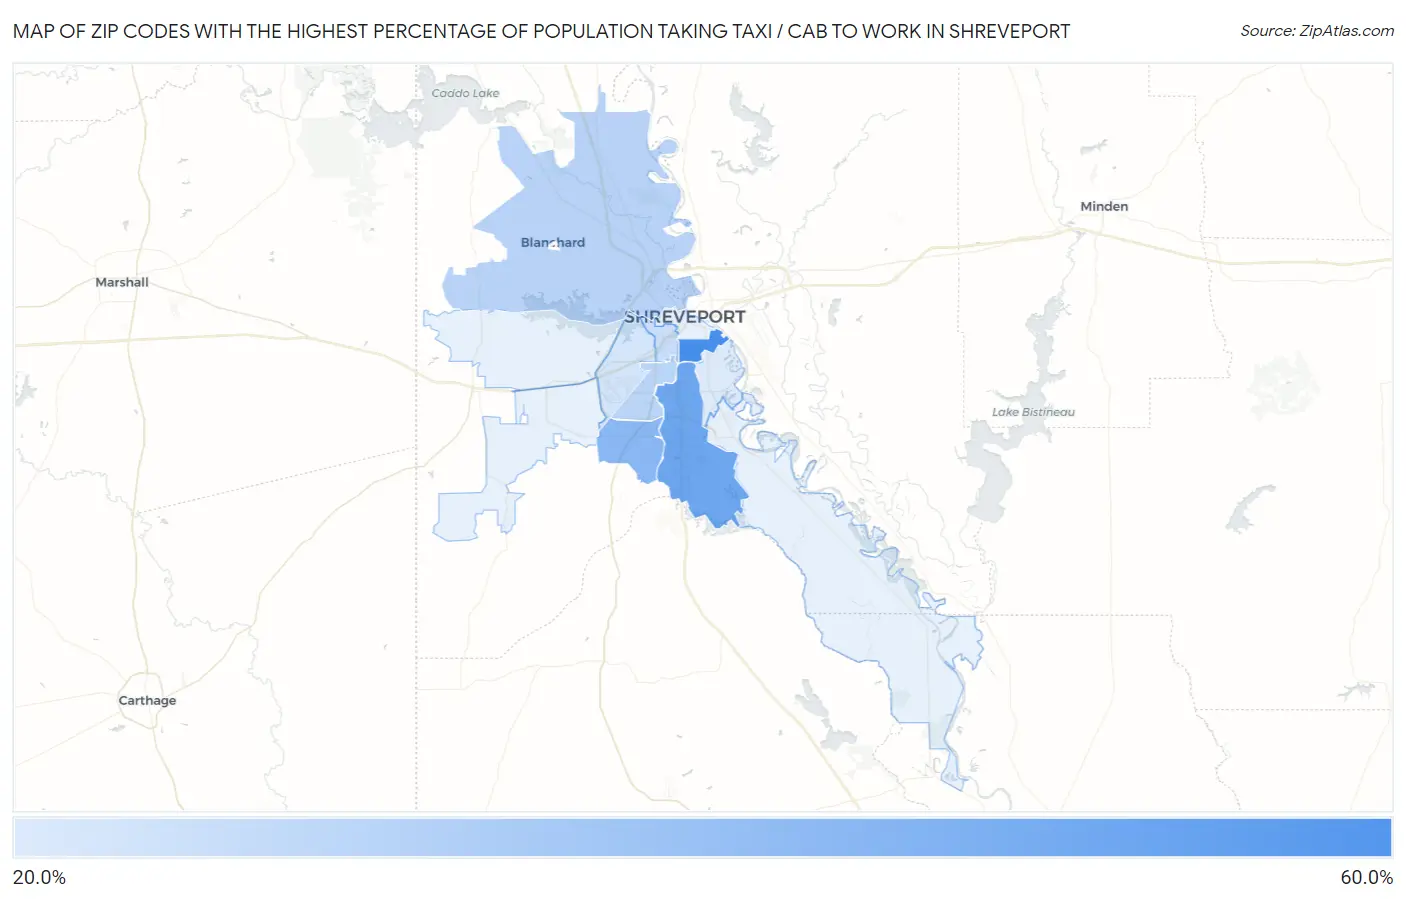
Map of Zip Codes with the Highest Percentage of Population Taking Taxi / Cab to Work in Shreveport
22.5%
59.3%
Zip Codes with the Highest Percentage of Population Taking Taxi / Cab to Work in Shreveport, LA
| Zip Code | % Take Taxi / Cab | vs State | vs National | |
| 1. | 71104 | 59.3% | 38.2%(+21.1)#9 | 38.2%(+21.1)#773 |
| 2. | 71106 | 48.5% | 38.2%(+10.3)#43 | 38.2%(+10.3)#3,416 |
| 3. | 71118 | 41.7% | 38.2%(+3.50)#69 | 38.2%(+3.50)#5,859 |
| 4. | 71107 | 30.7% | 38.2%(-7.50)#167 | 38.2%(-7.50)#10,666 |
| 5. | 71108 | 30.4% | 38.2%(-7.80)#169 | 38.2%(-7.80)#10,801 |
| 6. | 71103 | 26.9% | 38.2%(-11.3)#181 | 38.2%(-11.3)#11,856 |
| 7. | 71109 | 24.7% | 38.2%(-13.5)#187 | 38.2%(-13.5)#12,307 |
| 8. | 71105 | 22.5% | 38.2%(-15.7)#194 | 38.2%(-15.7)#12,709 |
1
Common Questions
What are the Top 10 Zip Codes with the Highest Percentage of Population Taking Taxi / Cab to Work in Shreveport, LA?
Top 10 Zip Codes with the Highest Percentage of Population Taking Taxi / Cab to Work in Shreveport, LA are:
What zip code has the Highest Percentage of Population Taking Taxi / Cab to Work in Shreveport, LA?
71104 has the Highest Percentage of Population Taking Taxi / Cab to Work in Shreveport, LA with 59.3%.
What is the Percentage of Population Taking Taxi / Cab to Work in Shreveport, LA?
Percentage of Population Taking Taxi / Cab to Work in Shreveport is 33.9%.
What is the Percentage of Population Taking Taxi / Cab to Work in Louisiana?
Percentage of Population Taking Taxi / Cab to Work in Louisiana is 38.2%.
What is the Percentage of Population Taking Taxi / Cab to Work in the United States?
Percentage of Population Taking Taxi / Cab to Work in the United States is 38.2%.