Zip Codes with the Highest Percentage of Population with a Degree in Visual and Performing Arts in Shreveport, LA
RELATED REPORTS & OPTIONS
Visual and Performing Arts
Shreveport
Compare Zip Codes
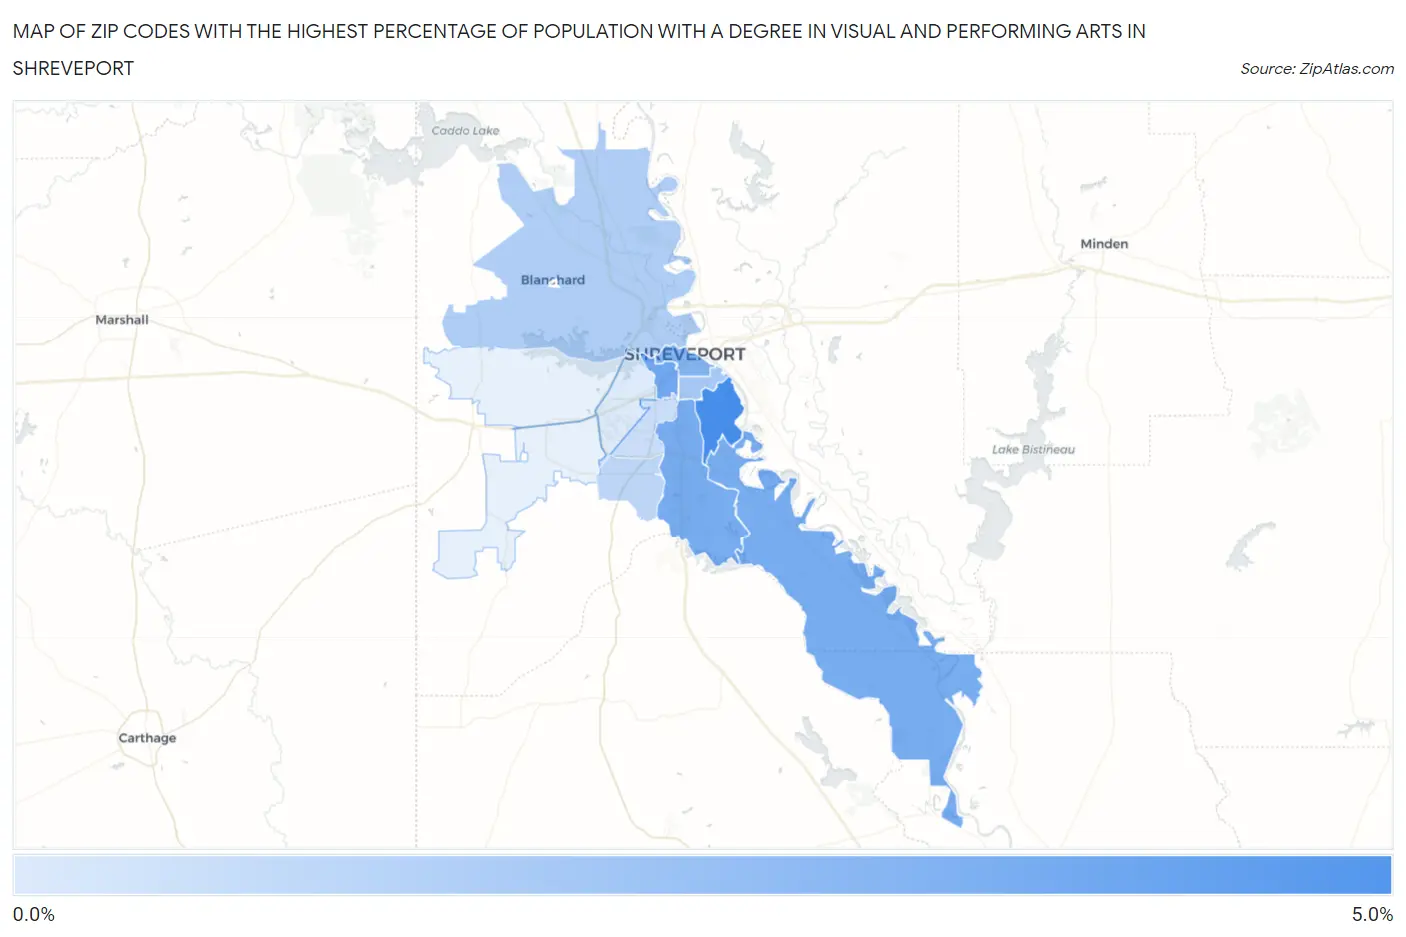
Map of Zip Codes with the Highest Percentage of Population with a Degree in Visual and Performing Arts in Shreveport
0.17%
4.8%
Zip Codes with the Highest Percentage of Population with a Degree in Visual and Performing Arts in Shreveport, LA
| Zip Code | % Graduates | vs State | vs National | |
| 1. | 71105 | 4.8% | 3.3%(+1.56)#49 | 4.3%(+0.589)#6,991 |
| 2. | 71103 | 3.5% | 3.3%(+0.232)#81 | 4.3%(-0.739)#10,834 |
| 3. | 71106 | 3.3% | 3.3%(+0.040)#86 | 4.3%(-0.931)#11,527 |
| 4. | 71115 | 3.3% | 3.3%(-0.005)#89 | 4.3%(-0.976)#11,708 |
| 5. | 71101 | 3.0% | 3.3%(-0.320)#107 | 4.3%(-1.29)#12,878 |
| 6. | 71104 | 1.8% | 3.3%(-1.43)#166 | 4.3%(-2.40)#16,966 |
| 7. | 71107 | 1.6% | 3.3%(-1.71)#180 | 4.3%(-2.68)#17,929 |
| 8. | 71118 | 1.1% | 3.3%(-2.14)#201 | 4.3%(-3.12)#19,271 |
| 9. | 71108 | 0.71% | 3.3%(-2.57)#221 | 4.3%(-3.54)#20,347 |
| 10. | 71109 | 0.17% | 3.3%(-3.11)#238 | 4.3%(-4.08)#21,207 |
1
Common Questions
What are the Top 10 Zip Codes with the Highest Percentage of Population with a Degree in Visual and Performing Arts in Shreveport, LA?
Top 10 Zip Codes with the Highest Percentage of Population with a Degree in Visual and Performing Arts in Shreveport, LA are:
What zip code has the Highest Percentage of Population with a Degree in Visual and Performing Arts in Shreveport, LA?
71105 has the Highest Percentage of Population with a Degree in Visual and Performing Arts in Shreveport, LA with 4.8%.
What is the Percentage of Population with a Degree in Visual and Performing Arts in Shreveport, LA?
Percentage of Population with a Degree in Visual and Performing Arts in Shreveport is 2.8%.
What is the Percentage of Population with a Degree in Visual and Performing Arts in Louisiana?
Percentage of Population with a Degree in Visual and Performing Arts in Louisiana is 3.3%.
What is the Percentage of Population with a Degree in Visual and Performing Arts in the United States?
Percentage of Population with a Degree in Visual and Performing Arts in the United States is 4.3%.