Zip Codes with the Highest Percentage of Population Employed in Installation, Maintenance & Repair in Shreveport, LA
RELATED REPORTS & OPTIONS
Installation, Maintenance & Repair
Shreveport
Compare Zip Codes
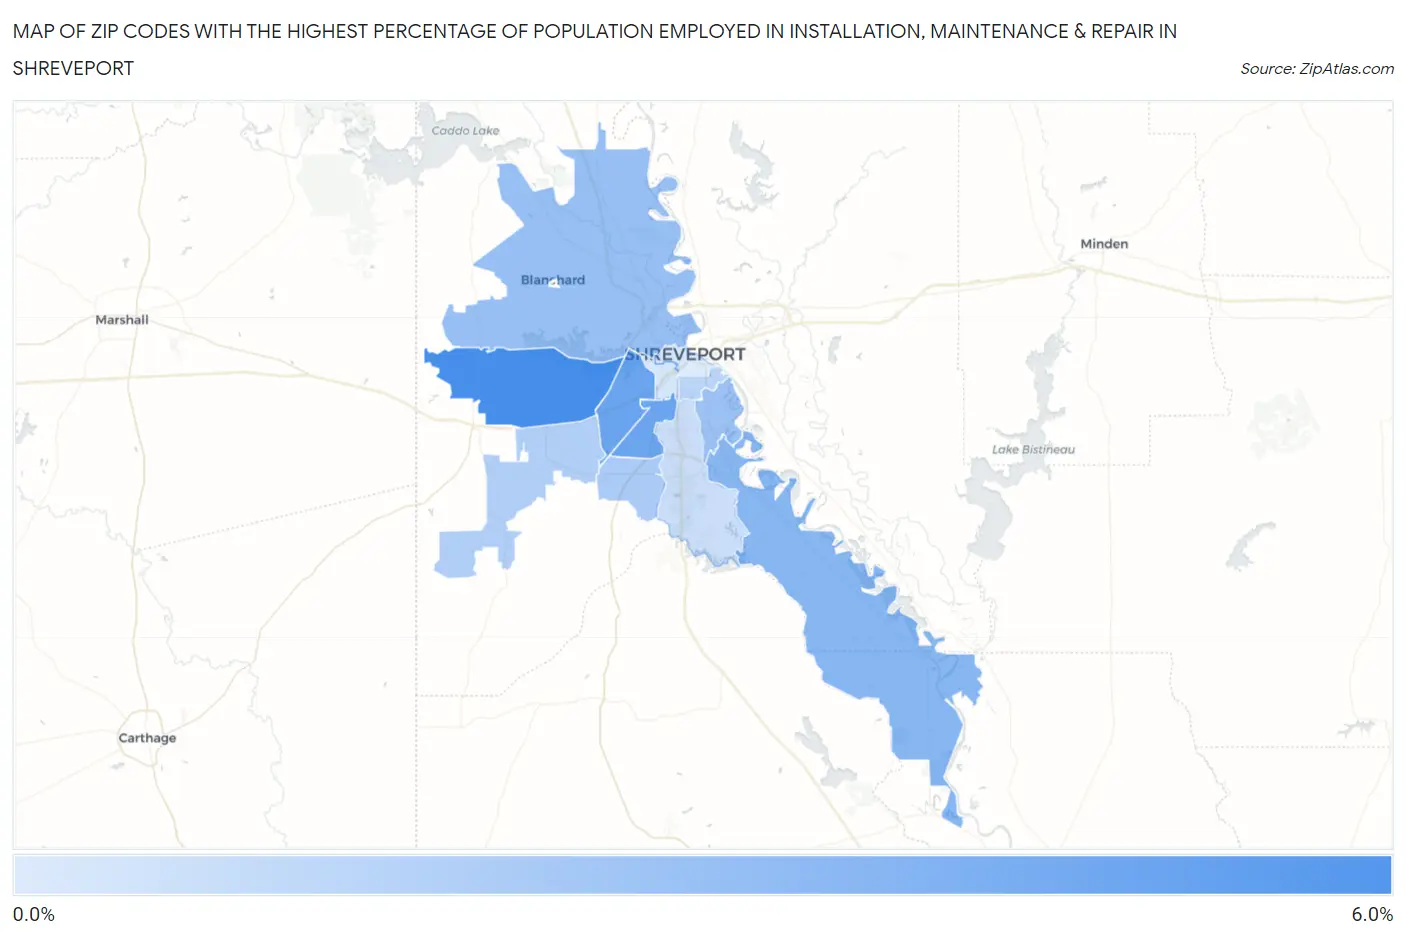
Map of Zip Codes with the Highest Percentage of Population Employed in Installation, Maintenance & Repair in Shreveport
0.36%
5.7%
Zip Codes with the Highest Percentage of Population Employed in Installation, Maintenance & Repair in Shreveport, LA
| Zip Code | % Employed | vs State | vs National | |
| 1. | 71119 | 5.7% | 3.7%(+2.02)#135 | 3.1%(+2.63)#6,791 |
| 2. | 71108 | 4.4% | 3.7%(+0.716)#213 | 3.1%(+1.33)#10,789 |
| 3. | 71109 | 4.3% | 3.7%(+0.641)#219 | 3.1%(+1.25)#11,077 |
| 4. | 71115 | 3.3% | 3.7%(-0.337)#286 | 3.1%(+0.275)#15,349 |
| 5. | 71107 | 2.8% | 3.7%(-0.903)#322 | 3.1%(-0.291)#18,130 |
| 6. | 71105 | 2.7% | 3.7%(-1.01)#330 | 3.1%(-0.397)#18,708 |
| 7. | 71118 | 2.2% | 3.7%(-1.51)#357 | 3.1%(-0.896)#21,213 |
| 8. | 71129 | 1.9% | 3.7%(-1.82)#370 | 3.1%(-1.20)#22,602 |
| 9. | 71104 | 1.5% | 3.7%(-2.13)#383 | 3.1%(-1.52)#23,981 |
| 10. | 71106 | 0.99% | 3.7%(-2.69)#410 | 3.1%(-2.08)#25,950 |
| 11. | 71103 | 0.61% | 3.7%(-3.07)#420 | 3.1%(-2.46)#26,987 |
| 12. | 71101 | 0.36% | 3.7%(-3.32)#422 | 3.1%(-2.70)#27,466 |
1
Common Questions
What are the Top 10 Zip Codes with the Highest Percentage of Population Employed in Installation, Maintenance & Repair in Shreveport, LA?
Top 10 Zip Codes with the Highest Percentage of Population Employed in Installation, Maintenance & Repair in Shreveport, LA are:
What zip code has the Highest Percentage of Population Employed in Installation, Maintenance & Repair in Shreveport, LA?
71119 has the Highest Percentage of Population Employed in Installation, Maintenance & Repair in Shreveport, LA with 5.7%.
What is the Percentage of Population Employed in Installation, Maintenance & Repair in Shreveport, LA?
Percentage of Population Employed in Installation, Maintenance & Repair in Shreveport is 2.4%.
What is the Percentage of Population Employed in Installation, Maintenance & Repair in Louisiana?
Percentage of Population Employed in Installation, Maintenance & Repair in Louisiana is 3.7%.
What is the Percentage of Population Employed in Installation, Maintenance & Repair in the United States?
Percentage of Population Employed in Installation, Maintenance & Repair in the United States is 3.1%.