Zip Codes with the Highest Percentage of Population Employed in Administrative & Support Services in Leawood, KS
RELATED REPORTS & OPTIONS
Administrative & Support Services
Leawood
Compare Zip Codes
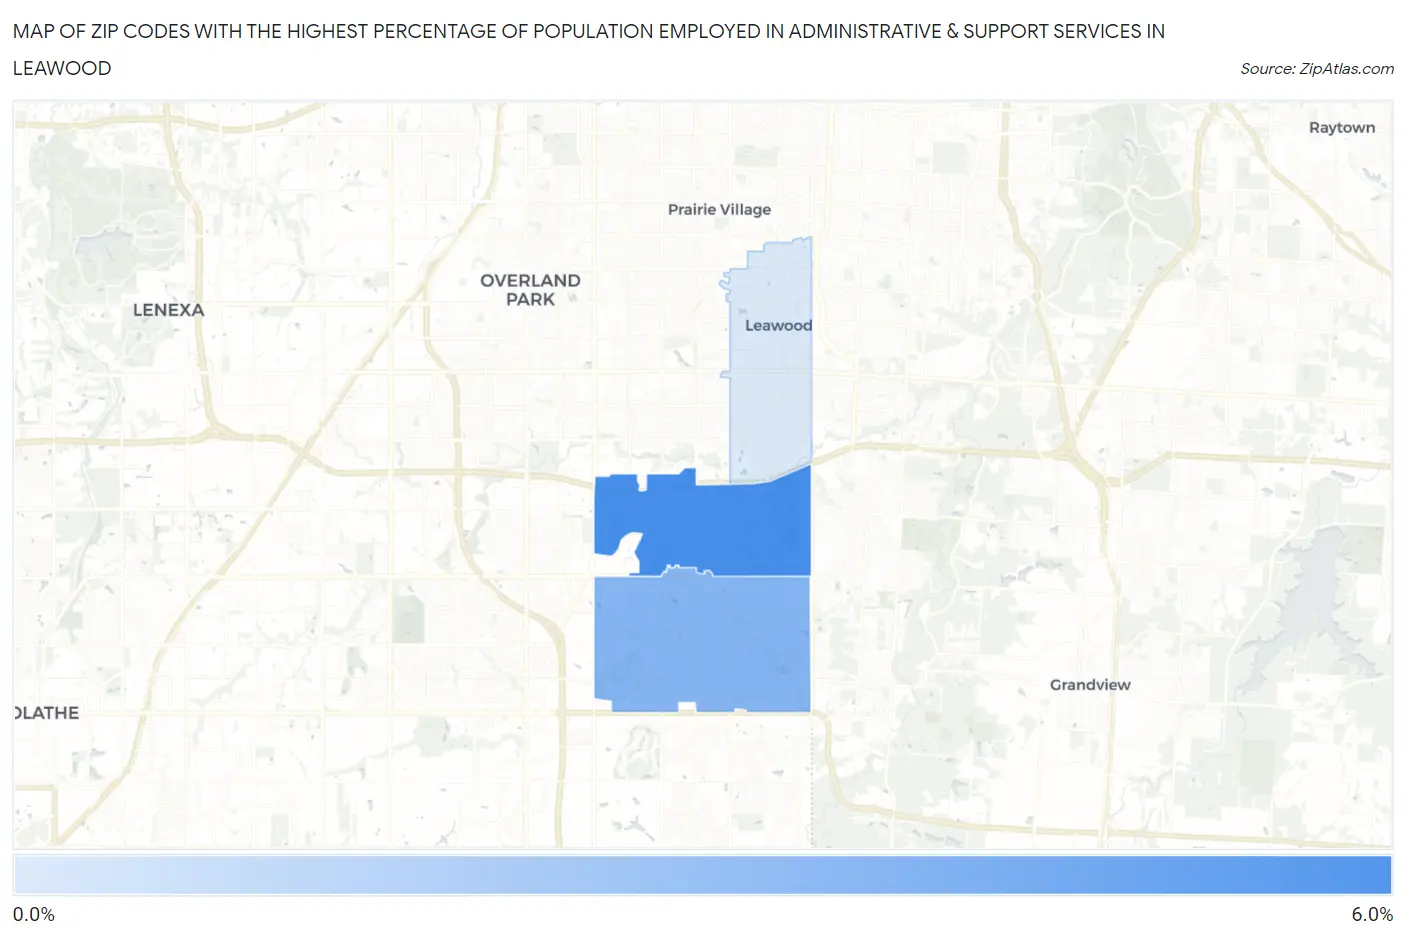
Map of Zip Codes with the Highest Percentage of Population Employed in Administrative & Support Services in Leawood
0.73%
5.4%
Zip Codes with the Highest Percentage of Population Employed in Administrative & Support Services in Leawood, KS
| Zip Code | % Employed | vs State | vs National | |
| 1. | 66211 | 5.4% | 3.2%(+2.18)#65 | 4.1%(+1.22)#6,156 |
| 2. | 66209 | 3.4% | 3.2%(+0.239)#161 | 4.1%(-0.723)#13,319 |
| 3. | 66206 | 0.73% | 3.2%(-2.46)#456 | 4.1%(-3.42)#25,302 |
1
Common Questions
What are the Top Zip Codes with the Highest Percentage of Population Employed in Administrative & Support Services in Leawood, KS?
Top Zip Codes with the Highest Percentage of Population Employed in Administrative & Support Services in Leawood, KS are:
What zip code has the Highest Percentage of Population Employed in Administrative & Support Services in Leawood, KS?
66211 has the Highest Percentage of Population Employed in Administrative & Support Services in Leawood, KS with 5.4%.
What is the Percentage of Population Employed in Administrative & Support Services in Leawood, KS?
Percentage of Population Employed in Administrative & Support Services in Leawood is 2.9%.
What is the Percentage of Population Employed in Administrative & Support Services in Kansas?
Percentage of Population Employed in Administrative & Support Services in Kansas is 3.2%.
What is the Percentage of Population Employed in Administrative & Support Services in the United States?
Percentage of Population Employed in Administrative & Support Services in the United States is 4.1%.