Zip Codes with the Most Immigrants from South Eastern Asia in Leawood, KS
RELATED REPORTS & OPTIONS
South Eastern Asia
Leawood
Compare Zip Codes
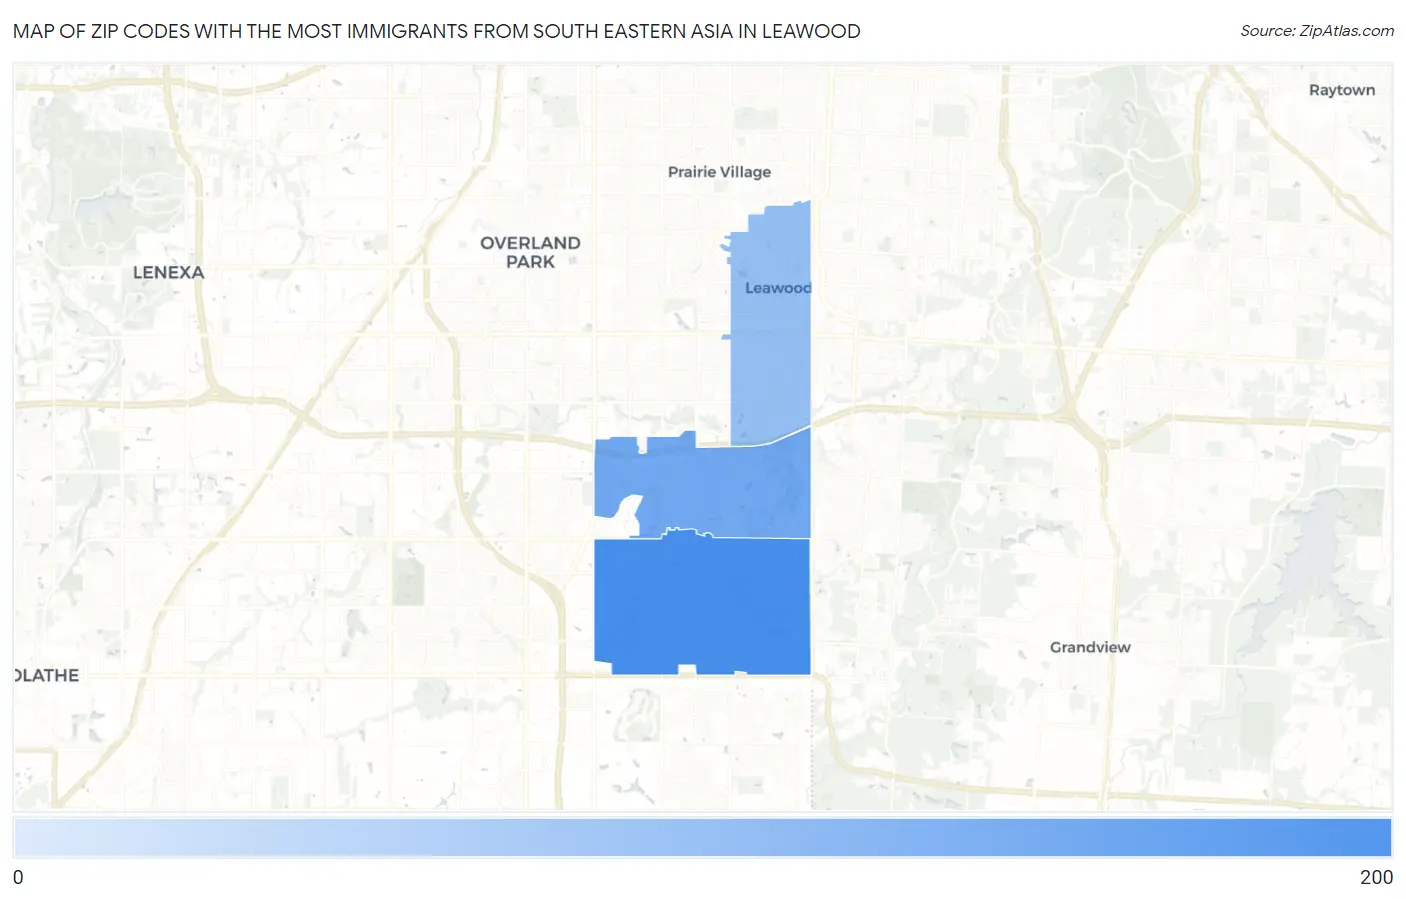
Map of Zip Codes with the Most Immigrants from South Eastern Asia in Leawood
11
177
Zip Codes with the Most Immigrants from South Eastern Asia in Leawood, KS
| Zip Code | South Eastern Asia | vs State | vs National | |
| 1. | 66209 | 177 | 26,393(0.67%)#46 | 4,292,058(0.00%)#4,362 |
| 2. | 66211 | 42 | 26,393(0.16%)#85 | 4,292,058(0.00%)#8,299 |
| 3. | 66206 | 11 | 26,393(0.04%)#133 | 4,292,058(0.00%)#11,626 |
1
Common Questions
What are the Top Zip Codes with the Most Immigrants from South Eastern Asia in Leawood, KS?
Top Zip Codes with the Most Immigrants from South Eastern Asia in Leawood, KS are:
What zip code has the Most Immigrants from South Eastern Asia in Leawood, KS?
66209 has the Most Immigrants from South Eastern Asia in Leawood, KS with 177.
What is the Total Immigrants from South Eastern Asia in Leawood, KS?
Total Immigrants from South Eastern Asia in Leawood is 229.
What is the Total Immigrants from South Eastern Asia in Kansas?
Total Immigrants from South Eastern Asia in Kansas is 26,393.
What is the Total Immigrants from South Eastern Asia in the United States?
Total Immigrants from South Eastern Asia in the United States is 4,292,058.