Zip Codes with the Highest Percentage of Population Employed in Legal Services & Support in Leawood, KS
RELATED REPORTS & OPTIONS
Legal Services & Support
Leawood
Compare Zip Codes
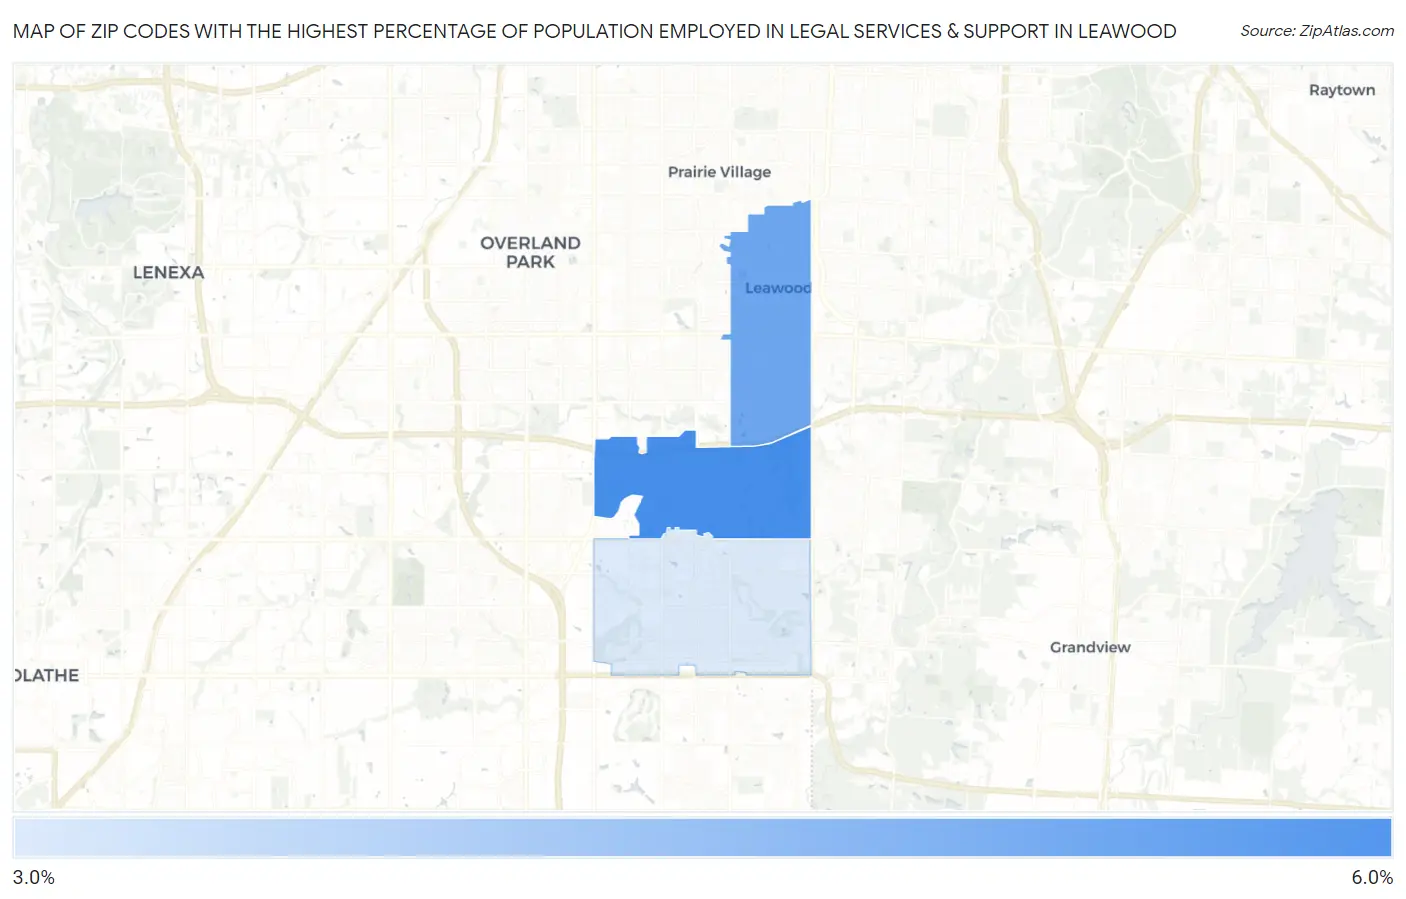
Map of Zip Codes with the Highest Percentage of Population Employed in Legal Services & Support in Leawood
3.5%
5.1%
Zip Codes with the Highest Percentage of Population Employed in Legal Services & Support in Leawood, KS
| Zip Code | % Employed | vs State | vs National | |
| 1. | 66211 | 5.1% | 0.90%(+4.17)#6 | 1.2%(+3.89)#699 |
| 2. | 66206 | 4.7% | 0.90%(+3.76)#8 | 1.2%(+3.48)#824 |
| 3. | 66209 | 3.5% | 0.90%(+2.59)#17 | 1.2%(+2.30)#1,447 |
1
Common Questions
What are the Top Zip Codes with the Highest Percentage of Population Employed in Legal Services & Support in Leawood, KS?
Top Zip Codes with the Highest Percentage of Population Employed in Legal Services & Support in Leawood, KS are:
What zip code has the Highest Percentage of Population Employed in Legal Services & Support in Leawood, KS?
66211 has the Highest Percentage of Population Employed in Legal Services & Support in Leawood, KS with 5.1%.
What is the Percentage of Population Employed in Legal Services & Support in Leawood, KS?
Percentage of Population Employed in Legal Services & Support in Leawood is 5.1%.
What is the Percentage of Population Employed in Legal Services & Support in Kansas?
Percentage of Population Employed in Legal Services & Support in Kansas is 0.90%.
What is the Percentage of Population Employed in Legal Services & Support in the United States?
Percentage of Population Employed in Legal Services & Support in the United States is 1.2%.