Ute vs Nonimmigrants College, Under 1 year
COMPARE
Ute
Nonimmigrants
College, Under 1 year
College, Under 1 year Comparison
Ute
Nonimmigrants
60.2%
COLLEGE, UNDER 1 YEAR
0.1/ 100
METRIC RATING
279th/ 347
METRIC RANK
62.9%
COLLEGE, UNDER 1 YEAR
3.0/ 100
METRIC RATING
230th/ 347
METRIC RANK
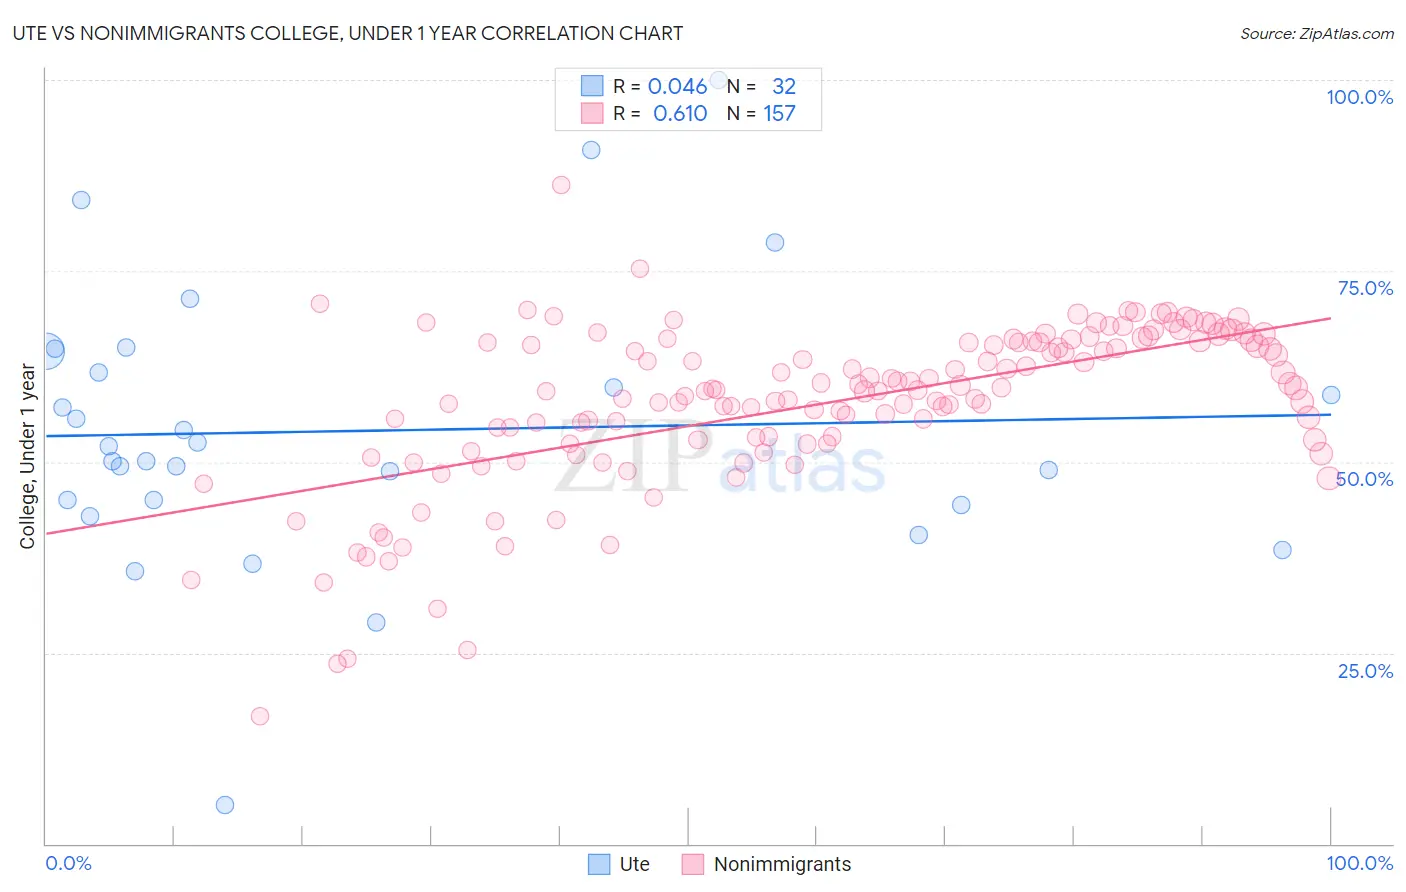
Ute vs Nonimmigrants College, Under 1 year Correlation Chart
The statistical analysis conducted on geographies consisting of 55,668,599 people shows no correlation between the proportion of Ute and percentage of population with at least college, under 1 year education in the United States with a correlation coefficient (R) of 0.046 and weighted average of 60.2%. Similarly, the statistical analysis conducted on geographies consisting of 585,317,870 people shows a significant positive correlation between the proportion of Nonimmigrants and percentage of population with at least college, under 1 year education in the United States with a correlation coefficient (R) of 0.610 and weighted average of 62.9%, a difference of 4.4%.
College, Under 1 year Correlation Summary
| Measurement | Ute | Nonimmigrants |
| Minimum | 5.1% | 16.7% |
| Maximum | 100.0% | 86.3% |
| Range | 94.9% | 69.6% |
| Mean | 54.1% | 57.6% |
| Median | 51.1% | 59.4% |
| Interquartile 25% (IQ1) | 44.6% | 52.7% |
| Interquartile 75% (IQ3) | 63.1% | 65.7% |
| Interquartile Range (IQR) | 18.5% | 13.0% |
| Standard Deviation (Sample) | 18.3% | 10.8% |
| Standard Deviation (Population) | 18.0% | 10.8% |
Similar Demographics by College, Under 1 year
Demographics Similar to Ute by College, Under 1 year
In terms of college, under 1 year, the demographic groups most similar to Ute are Yaqui (60.2%, a difference of 0.010%), Bahamian (60.3%, a difference of 0.050%), Crow (60.2%, a difference of 0.090%), Arapaho (60.3%, a difference of 0.18%), and Cherokee (60.1%, a difference of 0.20%).
| Demographics | Rating | Rank | College, Under 1 year |
| Jamaicans | 0.1 /100 | #272 | Tragic 60.5% |
| Chickasaw | 0.1 /100 | #273 | Tragic 60.4% |
| Alaska Natives | 0.1 /100 | #274 | Tragic 60.4% |
| Immigrants | Barbados | 0.1 /100 | #275 | Tragic 60.4% |
| Arapaho | 0.1 /100 | #276 | Tragic 60.3% |
| Bahamians | 0.1 /100 | #277 | Tragic 60.3% |
| Yaqui | 0.1 /100 | #278 | Tragic 60.2% |
| Ute | 0.1 /100 | #279 | Tragic 60.2% |
| Crow | 0.1 /100 | #280 | Tragic 60.2% |
| Cherokee | 0.1 /100 | #281 | Tragic 60.1% |
| Belizeans | 0.1 /100 | #282 | Tragic 60.1% |
| Immigrants | Jamaica | 0.0 /100 | #283 | Tragic 59.7% |
| Immigrants | St. Vincent and the Grenadines | 0.0 /100 | #284 | Tragic 59.6% |
| Paiute | 0.0 /100 | #285 | Tragic 59.6% |
| British West Indians | 0.0 /100 | #286 | Tragic 59.5% |
Demographics Similar to Nonimmigrants by College, Under 1 year
In terms of college, under 1 year, the demographic groups most similar to Nonimmigrants are Liberian (63.0%, a difference of 0.070%), Samoan (63.0%, a difference of 0.13%), Immigrants from Ghana (63.1%, a difference of 0.24%), Immigrants from Western Africa (62.8%, a difference of 0.24%), and Immigrants from Colombia (63.1%, a difference of 0.33%).
| Demographics | Rating | Rank | College, Under 1 year |
| Immigrants | Costa Rica | 4.5 /100 | #223 | Tragic 63.2% |
| Sub-Saharan Africans | 4.4 /100 | #224 | Tragic 63.2% |
| Immigrants | Peru | 4.0 /100 | #225 | Tragic 63.1% |
| Immigrants | Colombia | 4.0 /100 | #226 | Tragic 63.1% |
| Immigrants | Ghana | 3.7 /100 | #227 | Tragic 63.1% |
| Samoans | 3.3 /100 | #228 | Tragic 63.0% |
| Liberians | 3.2 /100 | #229 | Tragic 63.0% |
| Immigrants | Nonimmigrants | 3.0 /100 | #230 | Tragic 62.9% |
| Immigrants | Western Africa | 2.4 /100 | #231 | Tragic 62.8% |
| Osage | 2.2 /100 | #232 | Tragic 62.7% |
| Iroquois | 2.0 /100 | #233 | Tragic 62.6% |
| Chippewa | 2.0 /100 | #234 | Tragic 62.6% |
| Spanish Americans | 1.9 /100 | #235 | Tragic 62.6% |
| Immigrants | Immigrants | 1.7 /100 | #236 | Tragic 62.5% |
| Immigrants | Burma/Myanmar | 1.6 /100 | #237 | Tragic 62.5% |