Ute vs Immigrants from Laos College, Under 1 year
COMPARE
Ute
Immigrants from Laos
College, Under 1 year
College, Under 1 year Comparison
Ute
Immigrants from Laos
60.2%
COLLEGE, UNDER 1 YEAR
0.1/ 100
METRIC RATING
279th/ 347
METRIC RANK
61.3%
COLLEGE, UNDER 1 YEAR
0.3/ 100
METRIC RATING
257th/ 347
METRIC RANK
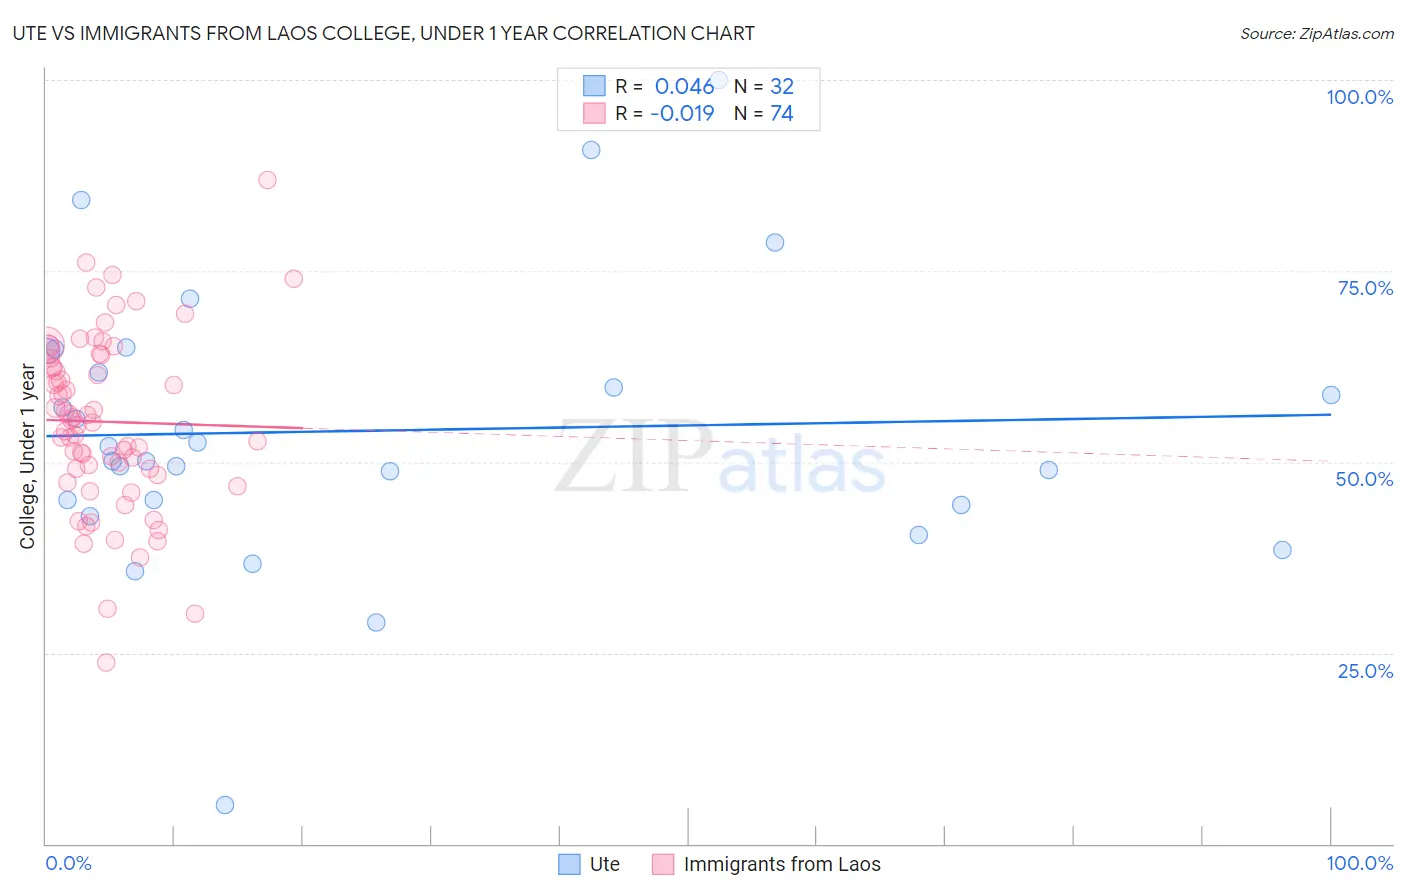
Ute vs Immigrants from Laos College, Under 1 year Correlation Chart
The statistical analysis conducted on geographies consisting of 55,668,599 people shows no correlation between the proportion of Ute and percentage of population with at least college, under 1 year education in the United States with a correlation coefficient (R) of 0.046 and weighted average of 60.2%. Similarly, the statistical analysis conducted on geographies consisting of 201,475,732 people shows no correlation between the proportion of Immigrants from Laos and percentage of population with at least college, under 1 year education in the United States with a correlation coefficient (R) of -0.019 and weighted average of 61.3%, a difference of 1.8%.
College, Under 1 year Correlation Summary
| Measurement | Ute | Immigrants from Laos |
| Minimum | 5.1% | 23.8% |
| Maximum | 100.0% | 86.9% |
| Range | 94.9% | 63.2% |
| Mean | 54.1% | 55.2% |
| Median | 51.1% | 55.3% |
| Interquartile 25% (IQ1) | 44.6% | 49.0% |
| Interquartile 75% (IQ3) | 63.1% | 63.6% |
| Interquartile Range (IQR) | 18.5% | 14.5% |
| Standard Deviation (Sample) | 18.3% | 11.4% |
| Standard Deviation (Population) | 18.0% | 11.4% |
Similar Demographics by College, Under 1 year
Demographics Similar to Ute by College, Under 1 year
In terms of college, under 1 year, the demographic groups most similar to Ute are Yaqui (60.2%, a difference of 0.010%), Bahamian (60.3%, a difference of 0.050%), Crow (60.2%, a difference of 0.090%), Arapaho (60.3%, a difference of 0.18%), and Cherokee (60.1%, a difference of 0.20%).
| Demographics | Rating | Rank | College, Under 1 year |
| Jamaicans | 0.1 /100 | #272 | Tragic 60.5% |
| Chickasaw | 0.1 /100 | #273 | Tragic 60.4% |
| Alaska Natives | 0.1 /100 | #274 | Tragic 60.4% |
| Immigrants | Barbados | 0.1 /100 | #275 | Tragic 60.4% |
| Arapaho | 0.1 /100 | #276 | Tragic 60.3% |
| Bahamians | 0.1 /100 | #277 | Tragic 60.3% |
| Yaqui | 0.1 /100 | #278 | Tragic 60.2% |
| Ute | 0.1 /100 | #279 | Tragic 60.2% |
| Crow | 0.1 /100 | #280 | Tragic 60.2% |
| Cherokee | 0.1 /100 | #281 | Tragic 60.1% |
| Belizeans | 0.1 /100 | #282 | Tragic 60.1% |
| Immigrants | Jamaica | 0.0 /100 | #283 | Tragic 59.7% |
| Immigrants | St. Vincent and the Grenadines | 0.0 /100 | #284 | Tragic 59.6% |
| Paiute | 0.0 /100 | #285 | Tragic 59.6% |
| British West Indians | 0.0 /100 | #286 | Tragic 59.5% |
Demographics Similar to Immigrants from Laos by College, Under 1 year
In terms of college, under 1 year, the demographic groups most similar to Immigrants from Laos are Immigrants from Bangladesh (61.3%, a difference of 0.060%), Indonesian (61.2%, a difference of 0.080%), Bangladeshi (61.4%, a difference of 0.11%), Comanche (61.4%, a difference of 0.16%), and Blackfeet (61.1%, a difference of 0.25%).
| Demographics | Rating | Rank | College, Under 1 year |
| Immigrants | Congo | 0.5 /100 | #250 | Tragic 61.7% |
| Immigrants | Micronesia | 0.5 /100 | #251 | Tragic 61.5% |
| West Indians | 0.4 /100 | #252 | Tragic 61.5% |
| Japanese | 0.4 /100 | #253 | Tragic 61.5% |
| Immigrants | Cambodia | 0.4 /100 | #254 | Tragic 61.5% |
| Comanche | 0.4 /100 | #255 | Tragic 61.4% |
| Bangladeshis | 0.4 /100 | #256 | Tragic 61.4% |
| Immigrants | Laos | 0.3 /100 | #257 | Tragic 61.3% |
| Immigrants | Bangladesh | 0.3 /100 | #258 | Tragic 61.3% |
| Indonesians | 0.3 /100 | #259 | Tragic 61.2% |
| Blackfeet | 0.3 /100 | #260 | Tragic 61.1% |
| Africans | 0.3 /100 | #261 | Tragic 61.1% |
| Barbadians | 0.2 /100 | #262 | Tragic 61.1% |
| Shoshone | 0.2 /100 | #263 | Tragic 61.1% |
| Trinidadians and Tobagonians | 0.2 /100 | #264 | Tragic 61.1% |