Ute vs Immigrants from Argentina College, Under 1 year
COMPARE
Ute
Immigrants from Argentina
College, Under 1 year
College, Under 1 year Comparison
Ute
Immigrants from Argentina
60.2%
COLLEGE, UNDER 1 YEAR
0.1/ 100
METRIC RATING
279th/ 347
METRIC RANK
67.9%
COLLEGE, UNDER 1 YEAR
97.0/ 100
METRIC RATING
100th/ 347
METRIC RANK
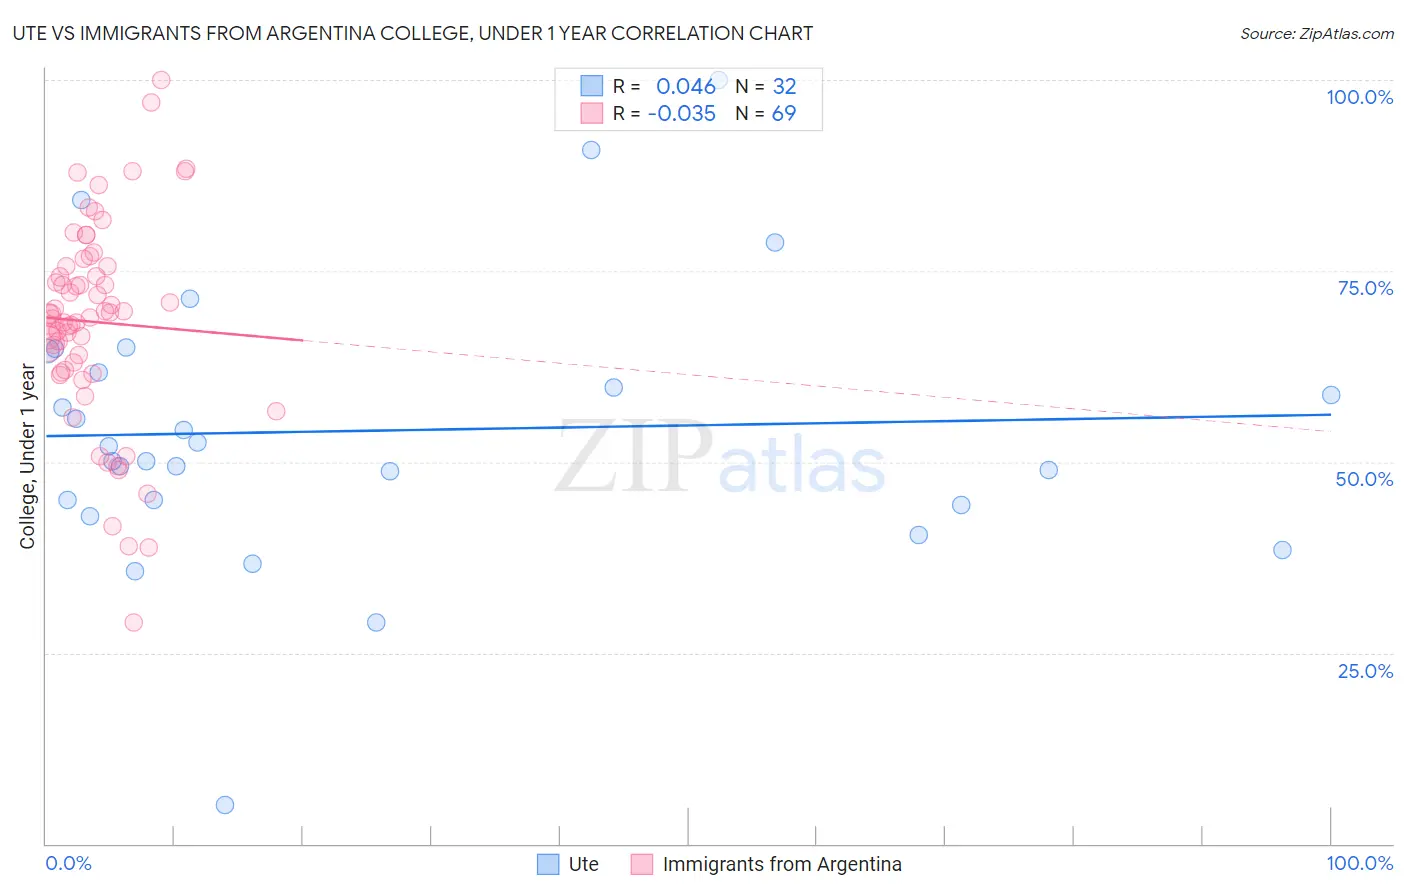
Ute vs Immigrants from Argentina College, Under 1 year Correlation Chart
The statistical analysis conducted on geographies consisting of 55,668,599 people shows no correlation between the proportion of Ute and percentage of population with at least college, under 1 year education in the United States with a correlation coefficient (R) of 0.046 and weighted average of 60.2%. Similarly, the statistical analysis conducted on geographies consisting of 264,437,906 people shows no correlation between the proportion of Immigrants from Argentina and percentage of population with at least college, under 1 year education in the United States with a correlation coefficient (R) of -0.035 and weighted average of 67.9%, a difference of 12.8%.
College, Under 1 year Correlation Summary
| Measurement | Ute | Immigrants from Argentina |
| Minimum | 5.1% | 29.0% |
| Maximum | 100.0% | 100.0% |
| Range | 94.9% | 71.0% |
| Mean | 54.1% | 68.3% |
| Median | 51.1% | 69.3% |
| Interquartile 25% (IQ1) | 44.6% | 61.9% |
| Interquartile 75% (IQ3) | 63.1% | 75.6% |
| Interquartile Range (IQR) | 18.5% | 13.7% |
| Standard Deviation (Sample) | 18.3% | 13.4% |
| Standard Deviation (Population) | 18.0% | 13.3% |
Similar Demographics by College, Under 1 year
Demographics Similar to Ute by College, Under 1 year
In terms of college, under 1 year, the demographic groups most similar to Ute are Yaqui (60.2%, a difference of 0.010%), Bahamian (60.3%, a difference of 0.050%), Crow (60.2%, a difference of 0.090%), Arapaho (60.3%, a difference of 0.18%), and Cherokee (60.1%, a difference of 0.20%).
| Demographics | Rating | Rank | College, Under 1 year |
| Jamaicans | 0.1 /100 | #272 | Tragic 60.5% |
| Chickasaw | 0.1 /100 | #273 | Tragic 60.4% |
| Alaska Natives | 0.1 /100 | #274 | Tragic 60.4% |
| Immigrants | Barbados | 0.1 /100 | #275 | Tragic 60.4% |
| Arapaho | 0.1 /100 | #276 | Tragic 60.3% |
| Bahamians | 0.1 /100 | #277 | Tragic 60.3% |
| Yaqui | 0.1 /100 | #278 | Tragic 60.2% |
| Ute | 0.1 /100 | #279 | Tragic 60.2% |
| Crow | 0.1 /100 | #280 | Tragic 60.2% |
| Cherokee | 0.1 /100 | #281 | Tragic 60.1% |
| Belizeans | 0.1 /100 | #282 | Tragic 60.1% |
| Immigrants | Jamaica | 0.0 /100 | #283 | Tragic 59.7% |
| Immigrants | St. Vincent and the Grenadines | 0.0 /100 | #284 | Tragic 59.6% |
| Paiute | 0.0 /100 | #285 | Tragic 59.6% |
| British West Indians | 0.0 /100 | #286 | Tragic 59.5% |
Demographics Similar to Immigrants from Argentina by College, Under 1 year
In terms of college, under 1 year, the demographic groups most similar to Immigrants from Argentina are Immigrants from Bolivia (67.9%, a difference of 0.010%), Paraguayan (67.9%, a difference of 0.030%), Immigrants from Eastern Europe (67.9%, a difference of 0.050%), Palestinian (67.9%, a difference of 0.050%), and Carpatho Rusyn (67.9%, a difference of 0.060%).
| Demographics | Rating | Rank | College, Under 1 year |
| Romanians | 97.9 /100 | #93 | Exceptional 68.2% |
| Armenians | 97.7 /100 | #94 | Exceptional 68.1% |
| Immigrants | Pakistan | 97.5 /100 | #95 | Exceptional 68.0% |
| Jordanians | 97.4 /100 | #96 | Exceptional 68.0% |
| Immigrants | Ethiopia | 97.3 /100 | #97 | Exceptional 68.0% |
| Paraguayans | 97.1 /100 | #98 | Exceptional 67.9% |
| Immigrants | Bolivia | 97.0 /100 | #99 | Exceptional 67.9% |
| Immigrants | Argentina | 97.0 /100 | #100 | Exceptional 67.9% |
| Immigrants | Eastern Europe | 96.9 /100 | #101 | Exceptional 67.9% |
| Palestinians | 96.9 /100 | #102 | Exceptional 67.9% |
| Carpatho Rusyns | 96.8 /100 | #103 | Exceptional 67.9% |
| Immigrants | Western Asia | 96.6 /100 | #104 | Exceptional 67.8% |
| Afghans | 96.6 /100 | #105 | Exceptional 67.8% |
| Immigrants | Croatia | 96.6 /100 | #106 | Exceptional 67.8% |
| Austrians | 96.4 /100 | #107 | Exceptional 67.8% |