Asian College, 1 year or more
COMPARE
Asian
Select to Compare
College, 1 year or more
Asian College, 1 year or more
64.2%
COLLEGE, 1 YEAR OR MORE
99.8/ 100
METRIC RATING
53rd/ 347
METRIC RANK
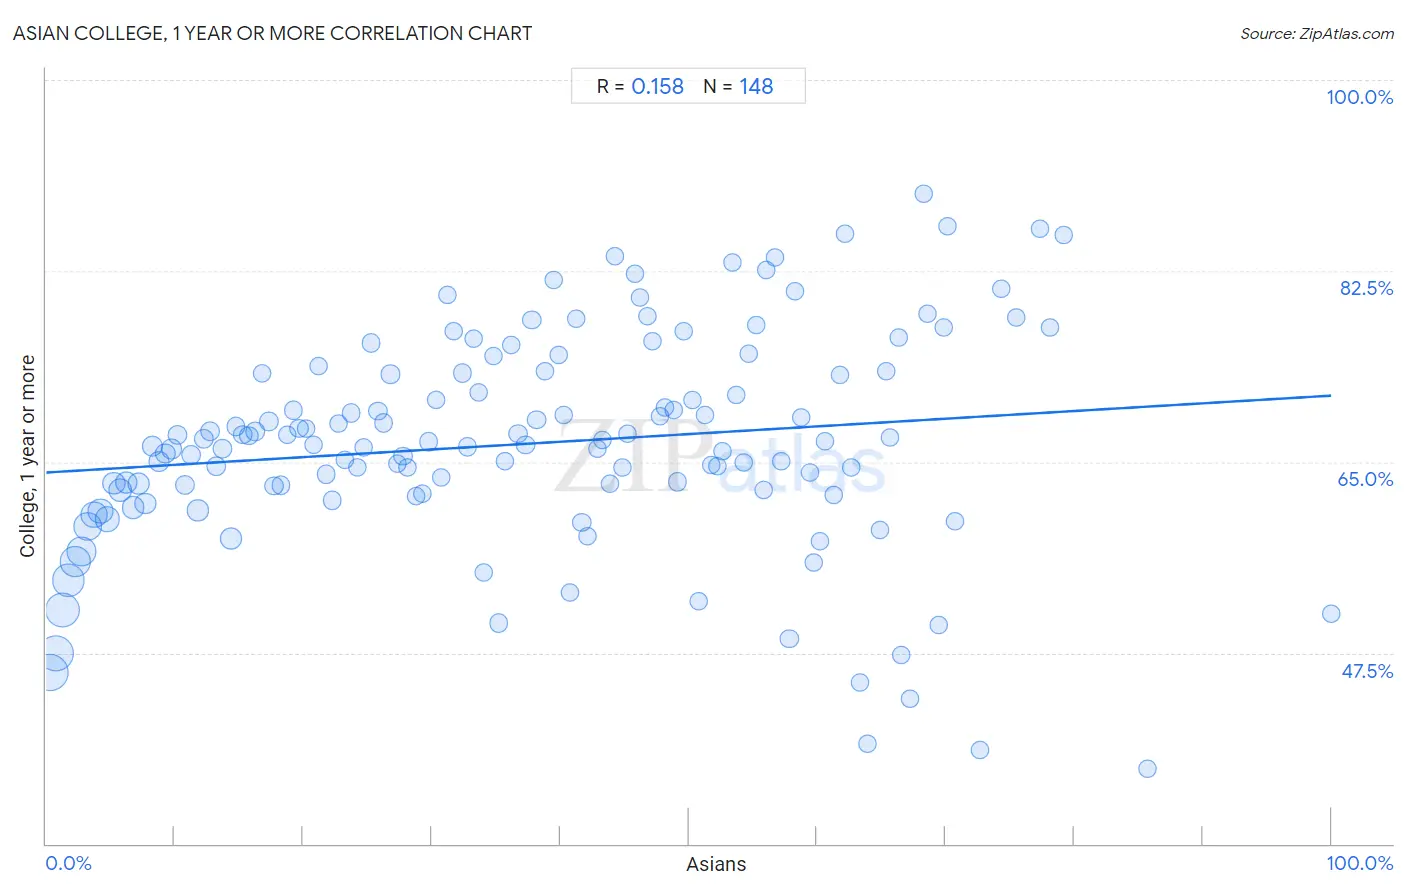
Asian College, 1 year or more Correlation Chart
The statistical analysis conducted on geographies consisting of 550,911,104 people shows a poor positive correlation between the proportion of Asians and percentage of population with at least college, 1 year or more education in the United States with a correlation coefficient (R) of 0.158 and weighted average of 64.2%. On average, for every 1% (one percent) increase in Asians within a typical geography, there is an increase of 0.071% in percentage of population with at least college, 1 year or more education.
It is essential to understand that the correlation between the percentage of Asians and percentage of population with at least college, 1 year or more education does not imply a direct cause-and-effect relationship. It remains uncertain whether the presence of Asians influences an upward or downward trend in the level of percentage of population with at least college, 1 year or more education within an area, or if Asians simply ended up residing in those areas with higher or lower levels of percentage of population with at least college, 1 year or more education due to other factors.
Demographics Similar to Asians by College, 1 year or more
In terms of college, 1 year or more, the demographic groups most similar to Asians are Immigrants from Netherlands (64.2%, a difference of 0.020%), Zimbabwean (64.2%, a difference of 0.030%), Immigrants from Belarus (64.1%, a difference of 0.15%), Immigrants from Czechoslovakia (64.1%, a difference of 0.17%), and Immigrants from Malaysia (64.3%, a difference of 0.18%).
| Demographics | Rating | Rank | College, 1 year or more |
| Bhutanese | 99.9 /100 | #46 | Exceptional 64.6% |
| Australians | 99.9 /100 | #47 | Exceptional 64.6% |
| Immigrants from Bulgaria | 99.9 /100 | #48 | Exceptional 64.6% |
| New Zealanders | 99.9 /100 | #49 | Exceptional 64.6% |
| Immigrants from Austria | 99.8 /100 | #50 | Exceptional 64.4% |
| Immigrants from Malaysia | 99.8 /100 | #51 | Exceptional 64.3% |
| Immigrants from Netherlands | 99.8 /100 | #52 | Exceptional 64.2% |
| Asians | 99.8 /100 | #53 | Exceptional 64.2% |
| Zimbabweans | 99.8 /100 | #54 | Exceptional 64.2% |
| Immigrants from Belarus | 99.7 /100 | #55 | Exceptional 64.1% |
| Immigrants from Czechoslovakia | 99.7 /100 | #56 | Exceptional 64.1% |
| South Africans | 99.7 /100 | #57 | Exceptional 64.1% |
| Immigrants from Asia | 99.7 /100 | #58 | Exceptional 64.0% |
| Immigrants from Serbia | 99.6 /100 | #59 | Exceptional 63.8% |
| Immigrants from Kazakhstan | 99.5 /100 | #60 | Exceptional 63.6% |
Asian College, 1 year or more Correlation Summary
| Measurement | Asian Data | College, 1 year or more Data |
| Minimum | 0.26% | 36.8% |
| Maximum | 100.0% | 89.5% |
| Range | 99.7% | 52.7% |
| Mean | 37.5% | 66.7% |
| Median | 37.0% | 66.6% |
| Interquartile 25% (IQ1) | 18.5% | 62.3% |
| Interquartile 75% (IQ3) | 55.6% | 73.1% |
| Interquartile Range (IQR) | 37.0% | 10.9% |
| Standard Deviation (Sample) | 22.4% | 10.0% |
| Standard Deviation (Population) | 22.3% | 10.0% |
Correlation Details
| Asian Percentile | Sample Size | College, 1 year or more |
[ 0.0% - 0.5% ] 0.26% | 53,806,235 | 45.7% |
[ 0.5% - 1.0% ] 0.74% | 52,455,480 | 47.4% |
[ 1.0% - 1.5% ] 1.25% | 46,686,461 | 51.4% |
[ 1.5% - 2.0% ] 1.74% | 41,579,592 | 54.1% |
[ 2.0% - 2.5% ] 2.25% | 34,196,128 | 55.9% |
[ 2.5% - 3.0% ] 2.73% | 31,102,800 | 56.8% |
[ 3.0% - 3.5% ] 3.24% | 27,662,486 | 59.1% |
[ 3.5% - 4.0% ] 3.73% | 23,012,101 | 60.1% |
[ 4.0% - 4.5% ] 4.21% | 18,717,517 | 60.5% |
[ 4.5% - 5.0% ] 4.73% | 19,060,799 | 59.8% |
[ 5.0% - 5.5% ] 5.26% | 13,515,721 | 63.1% |
[ 5.5% - 6.0% ] 5.75% | 13,311,114 | 62.4% |
[ 6.0% - 6.5% ] 6.23% | 10,587,573 | 63.1% |
[ 6.5% - 7.0% ] 6.76% | 14,169,260 | 60.8% |
[ 7.0% - 7.5% ] 7.18% | 11,643,695 | 63.0% |
[ 7.5% - 8.0% ] 7.71% | 8,609,595 | 61.2% |
[ 8.0% - 8.5% ] 8.27% | 7,562,127 | 66.5% |
[ 8.5% - 9.0% ] 8.76% | 5,663,445 | 65.0% |
[ 9.0% - 9.5% ] 9.25% | 5,233,152 | 65.8% |
[ 9.5% - 10.0% ] 9.75% | 5,641,358 | 66.2% |
[ 10.0% - 10.5% ] 10.25% | 3,933,076 | 67.5% |
[ 10.5% - 11.0% ] 10.76% | 3,962,750 | 62.8% |
[ 11.0% - 11.5% ] 11.24% | 4,229,502 | 65.6% |
[ 11.5% - 12.0% ] 11.79% | 8,672,681 | 60.5% |
[ 12.0% - 12.5% ] 12.27% | 3,122,982 | 67.1% |
[ 12.5% - 13.0% ] 12.72% | 3,402,832 | 67.8% |
[ 13.0% - 13.5% ] 13.26% | 3,637,638 | 64.6% |
[ 13.5% - 14.0% ] 13.74% | 4,012,261 | 66.2% |
[ 14.0% - 14.5% ] 14.40% | 12,099,747 | 58.0% |
[ 14.5% - 15.0% ] 14.77% | 2,109,356 | 68.2% |
[ 15.0% - 15.5% ] 15.27% | 2,022,406 | 67.5% |
[ 15.5% - 16.0% ] 15.78% | 3,039,819 | 67.4% |
[ 16.0% - 16.5% ] 16.23% | 2,380,306 | 67.8% |
[ 16.5% - 17.0% ] 16.79% | 2,265,977 | 73.1% |
[ 17.0% - 17.5% ] 17.31% | 2,605,435 | 68.7% |
[ 17.5% - 18.0% ] 17.71% | 2,018,647 | 62.8% |
[ 18.0% - 18.5% ] 18.28% | 2,038,923 | 62.8% |
[ 18.5% - 19.0% ] 18.74% | 1,276,906 | 67.4% |
[ 19.0% - 19.5% ] 19.25% | 2,085,969 | 69.7% |
[ 19.5% - 20.0% ] 19.68% | 1,861,971 | 68.1% |
[ 20.0% - 20.5% ] 20.25% | 957,945 | 68.0% |
[ 20.5% - 21.0% ] 20.80% | 1,156,264 | 66.6% |
[ 21.0% - 21.5% ] 21.20% | 1,003,848 | 73.8% |
[ 21.5% - 22.0% ] 21.75% | 500,723 | 63.9% |
[ 22.0% - 22.5% ] 22.26% | 1,516,207 | 61.5% |
[ 22.5% - 23.0% ] 22.73% | 1,219,067 | 68.5% |
[ 23.0% - 23.5% ] 23.26% | 801,272 | 65.2% |
[ 23.5% - 24.0% ] 23.75% | 726,353 | 69.5% |
[ 24.0% - 24.5% ] 24.25% | 784,027 | 64.5% |
[ 24.5% - 25.0% ] 24.70% | 696,709 | 66.3% |
[ 25.0% - 25.5% ] 25.28% | 977,438 | 75.9% |
[ 25.5% - 26.0% ] 25.80% | 1,136,573 | 69.7% |
[ 26.0% - 26.5% ] 26.26% | 1,025,589 | 68.6% |
[ 26.5% - 27.0% ] 26.78% | 898,024 | 73.0% |
[ 27.0% - 27.5% ] 27.30% | 800,639 | 64.8% |
[ 27.5% - 28.0% ] 27.76% | 460,265 | 65.6% |
[ 28.0% - 28.5% ] 28.15% | 399,530 | 64.5% |
[ 28.5% - 29.0% ] 28.77% | 848,752 | 61.8% |
[ 29.0% - 29.5% ] 29.25% | 632,025 | 62.1% |
[ 29.5% - 30.0% ] 29.75% | 875,991 | 66.8% |
[ 30.0% - 30.5% ] 30.33% | 681,741 | 70.6% |
[ 30.5% - 31.0% ] 30.69% | 316,830 | 63.6% |
[ 31.0% - 31.5% ] 31.25% | 435,356 | 80.3% |
[ 31.5% - 32.0% ] 31.70% | 354,328 | 77.0% |
[ 32.0% - 32.5% ] 32.36% | 283,359 | 73.1% |
[ 32.5% - 33.0% ] 32.75% | 379,325 | 66.4% |
[ 33.0% - 33.5% ] 33.24% | 510,629 | 76.3% |
[ 33.5% - 34.0% ] 33.68% | 515,682 | 71.3% |
[ 34.0% - 34.5% ] 34.06% | 110,219 | 54.8% |
[ 34.5% - 35.0% ] 34.79% | 1,325,296 | 74.7% |
[ 35.0% - 35.5% ] 35.24% | 335,763 | 50.2% |
[ 35.5% - 36.0% ] 35.71% | 538,620 | 65.0% |
[ 36.0% - 36.5% ] 36.17% | 140,910 | 75.7% |
[ 36.5% - 37.0% ] 36.72% | 483,172 | 67.6% |
[ 37.0% - 37.5% ] 37.30% | 562,986 | 66.6% |
[ 37.5% - 38.0% ] 37.79% | 446,356 | 78.0% |
[ 38.0% - 38.5% ] 38.17% | 1,332,443 | 68.8% |
[ 38.5% - 39.0% ] 38.79% | 217,104 | 73.3% |
[ 39.0% - 39.5% ] 39.47% | 244,422 | 81.6% |
[ 39.5% - 40.0% ] 39.89% | 299,666 | 74.8% |
[ 40.0% - 40.5% ] 40.27% | 156,576 | 69.3% |
[ 40.5% - 41.0% ] 40.75% | 143,305 | 53.0% |
[ 41.0% - 41.5% ] 41.20% | 214,066 | 78.2% |
[ 41.5% - 42.0% ] 41.68% | 558,810 | 59.4% |
[ 42.0% - 42.5% ] 42.12% | 123,436 | 58.2% |
[ 42.5% - 43.0% ] 42.85% | 178,995 | 66.3% |
[ 43.0% - 43.5% ] 43.29% | 292,241 | 67.0% |
[ 43.5% - 44.0% ] 43.84% | 213,582 | 63.0% |
[ 44.0% - 44.5% ] 44.29% | 406,566 | 83.9% |
[ 44.5% - 45.0% ] 44.80% | 142,721 | 64.5% |
[ 45.0% - 45.5% ] 45.20% | 70,333 | 67.6% |
[ 45.5% - 46.0% ] 45.82% | 31,392 | 82.2% |
[ 46.0% - 46.5% ] 46.23% | 74,176 | 80.0% |
[ 46.5% - 47.0% ] 46.76% | 188,727 | 78.4% |
[ 47.0% - 47.5% ] 47.19% | 195,881 | 76.0% |
[ 47.5% - 48.0% ] 47.75% | 135,081 | 69.1% |
[ 48.0% - 48.5% ] 48.13% | 228,738 | 70.0% |
[ 48.5% - 49.0% ] 48.80% | 149,573 | 69.7% |
[ 49.0% - 49.5% ] 49.17% | 268,981 | 63.2% |
[ 49.5% - 50.0% ] 49.63% | 209,739 | 77.0% |
[ 50.0% - 50.5% ] 50.33% | 156,457 | 70.7% |
[ 50.5% - 51.0% ] 50.75% | 223,066 | 52.2% |
[ 51.0% - 51.5% ] 51.31% | 193,613 | 69.3% |
[ 51.5% - 52.0% ] 51.77% | 120,112 | 64.7% |
[ 52.0% - 52.5% ] 52.26% | 550,031 | 64.6% |
[ 52.5% - 53.0% ] 52.62% | 86,202 | 66.0% |
[ 53.0% - 53.5% ] 53.39% | 179,366 | 83.3% |
[ 53.5% - 54.0% ] 53.74% | 168,493 | 71.2% |
[ 54.0% - 54.5% ] 54.31% | 156,175 | 65.0% |
[ 54.5% - 55.0% ] 54.70% | 178,510 | 74.9% |
[ 55.0% - 55.5% ] 55.23% | 68,476 | 77.6% |
[ 55.5% - 56.0% ] 55.87% | 196,325 | 62.5% |
[ 56.0% - 56.5% ] 56.01% | 16,722 | 82.6% |
[ 56.5% - 57.0% ] 56.73% | 21,402 | 83.7% |
[ 57.0% - 57.5% ] 57.17% | 94,153 | 65.0% |
[ 57.5% - 58.0% ] 57.83% | 68,242 | 48.8% |
[ 58.0% - 58.5% ] 58.24% | 134,842 | 80.7% |
[ 58.5% - 59.0% ] 58.79% | 229,316 | 69.1% |
[ 59.0% - 59.5% ] 59.41% | 93,745 | 64.1% |
[ 59.5% - 60.0% ] 59.77% | 43,886 | 55.8% |
[ 60.0% - 60.5% ] 60.23% | 187,009 | 57.7% |
[ 60.5% - 61.0% ] 60.60% | 153,666 | 66.9% |
[ 61.0% - 61.5% ] 61.27% | 132,470 | 61.9% |
[ 61.5% - 62.0% ] 61.81% | 265,452 | 73.0% |
[ 62.0% - 62.5% ] 62.16% | 21,929 | 85.9% |
[ 62.5% - 63.0% ] 62.67% | 166,706 | 64.5% |
[ 63.0% - 63.5% ] 63.32% | 59,151 | 44.7% |
[ 63.5% - 64.0% ] 63.93% | 59,410 | 39.2% |
[ 64.5% - 65.0% ] 64.88% | 101,367 | 58.7% |
[ 65.0% - 65.5% ] 65.39% | 117,012 | 73.3% |
[ 65.5% - 66.0% ] 65.67% | 64,377 | 67.3% |
[ 66.0% - 66.5% ] 66.31% | 4,185 | 76.4% |
[ 66.5% - 67.0% ] 66.58% | 54,137 | 47.3% |
[ 67.0% - 67.5% ] 67.23% | 40,134 | 43.3% |
[ 68.0% - 68.5% ] 68.31% | 25,001 | 89.5% |
[ 68.5% - 69.0% ] 68.56% | 39,565 | 78.6% |
[ 69.0% - 69.5% ] 69.44% | 8,835 | 50.0% |
[ 69.5% - 70.0% ] 69.85% | 219,899 | 77.4% |
[ 70.0% - 70.5% ] 70.18% | 68,801 | 86.6% |
[ 70.5% - 71.0% ] 70.74% | 57,900 | 59.6% |
[ 72.5% - 73.0% ] 72.64% | 79,495 | 38.6% |
[ 74.0% - 74.5% ] 74.33% | 37,671 | 80.9% |
[ 75.5% - 76.0% ] 75.52% | 2,549 | 78.3% |
[ 77.0% - 77.5% ] 77.32% | 53,464 | 86.3% |
[ 78.0% - 78.5% ] 78.09% | 178 | 77.3% |
[ 79.0% - 79.5% ] 79.14% | 954 | 85.8% |
[ 85.5% - 86.0% ] 85.71% | 42 | 36.8% |
[ 99.5% - 100.0% ] 100.00% | 421 | 51.1% |