American College, 1 year or more
COMPARE
American
Select to Compare
College, 1 year or more
American College, 1 year or more
54.4%
COLLEGE, 1 YEAR OR MORE
0.2/ 100
METRIC RATING
275th/ 347
METRIC RANK
American College, 1 year or more Correlation Chart
The statistical analysis conducted on geographies consisting of 581,967,268 people shows a moderate negative correlation between the proportion of Americans and percentage of population with at least college, 1 year or more education in the United States with a correlation coefficient (R) of -0.438 and weighted average of 54.4%. On average, for every 1% (one percent) increase in Americans within a typical geography, there is a decrease of 0.20% in percentage of population with at least college, 1 year or more education.
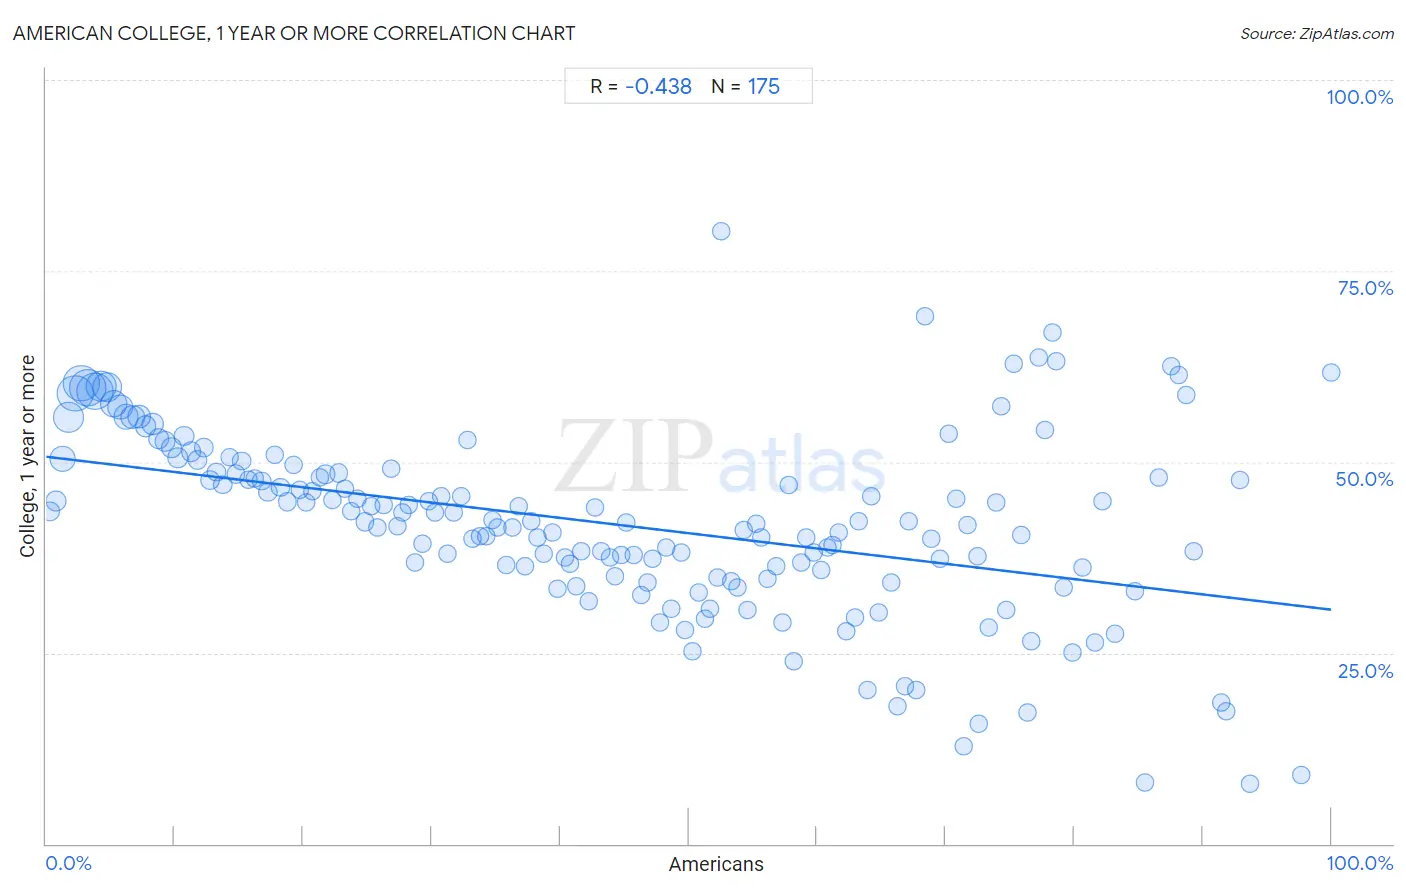
It is essential to understand that the correlation between the percentage of Americans and percentage of population with at least college, 1 year or more education does not imply a direct cause-and-effect relationship. It remains uncertain whether the presence of Americans influences an upward or downward trend in the level of percentage of population with at least college, 1 year or more education within an area, or if Americans simply ended up residing in those areas with higher or lower levels of percentage of population with at least college, 1 year or more education due to other factors.
Demographics Similar to Americans by College, 1 year or more
In terms of college, 1 year or more, the demographic groups most similar to Americans are Belizean (54.4%, a difference of 0.020%), Immigrants from Grenada (54.4%, a difference of 0.060%), Shoshone (54.3%, a difference of 0.080%), Comanche (54.4%, a difference of 0.10%), and Ecuadorian (54.3%, a difference of 0.12%).
| Demographics | Rating | Rank | College, 1 year or more |
| British West Indians | 0.2 /100 | #268 | Tragic 54.5% |
| Bangladeshis | 0.2 /100 | #269 | Tragic 54.5% |
| Crow | 0.2 /100 | #270 | Tragic 54.5% |
| Bahamians | 0.2 /100 | #271 | Tragic 54.5% |
| Comanche | 0.2 /100 | #272 | Tragic 54.4% |
| Immigrants from Grenada | 0.2 /100 | #273 | Tragic 54.4% |
| Belizeans | 0.2 /100 | #274 | Tragic 54.4% |
| Americans | 0.2 /100 | #275 | Tragic 54.4% |
| Shoshone | 0.2 /100 | #276 | Tragic 54.3% |
| Ecuadorians | 0.2 /100 | #277 | Tragic 54.3% |
| Immigrants from Jamaica | 0.1 /100 | #278 | Tragic 54.2% |
| Arapaho | 0.1 /100 | #279 | Tragic 54.1% |
| Cheyenne | 0.1 /100 | #280 | Tragic 54.1% |
| Colville | 0.1 /100 | #281 | Tragic 54.1% |
| Guyanese | 0.1 /100 | #282 | Tragic 54.1% |
American College, 1 year or more Correlation Summary
| Measurement | American Data | College, 1 year or more Data |
| Minimum | 0.33% | 7.8% |
| Maximum | 100.0% | 80.1% |
| Range | 99.7% | 72.3% |
| Mean | 44.4% | 41.8% |
| Median | 43.9% | 42.0% |
| Interquartile 25% (IQ1) | 21.7% | 35.0% |
| Interquartile 75% (IQ3) | 66.3% | 48.5% |
| Interquartile Range (IQR) | 44.5% | 13.6% |
| Standard Deviation (Sample) | 26.4% | 12.1% |
| Standard Deviation (Population) | 26.3% | 12.0% |
Correlation Details
| American Percentile | Sample Size | College, 1 year or more |
[ 0.0% - 0.5% ] 0.33% | 2,904,114 | 43.5% |
[ 0.5% - 1.0% ] 0.79% | 9,328,204 | 44.9% |
[ 1.0% - 1.5% ] 1.28% | 22,685,161 | 50.4% |
[ 1.5% - 2.0% ] 1.76% | 39,882,534 | 55.8% |
[ 2.0% - 2.5% ] 2.26% | 56,445,918 | 58.9% |
[ 2.5% - 3.0% ] 2.75% | 57,586,949 | 60.3% |
[ 3.0% - 3.5% ] 3.24% | 56,636,871 | 59.7% |
[ 3.5% - 4.0% ] 3.75% | 58,069,676 | 59.2% |
[ 4.0% - 4.5% ] 4.25% | 39,218,835 | 59.9% |
[ 4.5% - 5.0% ] 4.74% | 36,937,576 | 59.8% |
[ 5.0% - 5.5% ] 5.25% | 27,455,408 | 57.7% |
[ 5.5% - 6.0% ] 5.76% | 21,815,792 | 57.2% |
[ 6.0% - 6.5% ] 6.24% | 20,204,633 | 55.9% |
[ 6.5% - 7.0% ] 6.75% | 17,758,335 | 55.8% |
[ 7.0% - 7.5% ] 7.24% | 13,282,480 | 55.9% |
[ 7.5% - 8.0% ] 7.74% | 11,311,113 | 54.6% |
[ 8.0% - 8.5% ] 8.26% | 10,167,212 | 54.9% |
[ 8.5% - 9.0% ] 8.74% | 7,913,008 | 53.1% |
[ 9.0% - 9.5% ] 9.25% | 7,284,923 | 52.7% |
[ 9.5% - 10.0% ] 9.74% | 6,234,159 | 51.8% |
[ 10.0% - 10.5% ] 10.24% | 5,958,793 | 50.6% |
[ 10.5% - 11.0% ] 10.73% | 5,673,494 | 53.4% |
[ 11.0% - 11.5% ] 11.24% | 4,780,579 | 51.3% |
[ 11.5% - 12.0% ] 11.72% | 4,200,875 | 50.2% |
[ 12.0% - 12.5% ] 12.25% | 3,411,151 | 51.8% |
[ 12.5% - 13.0% ] 12.73% | 3,276,844 | 47.6% |
[ 13.0% - 13.5% ] 13.24% | 2,486,520 | 48.6% |
[ 13.5% - 14.0% ] 13.75% | 2,207,023 | 47.0% |
[ 14.0% - 14.5% ] 14.27% | 2,023,531 | 50.6% |
[ 14.5% - 15.0% ] 14.76% | 1,770,802 | 48.4% |
[ 15.0% - 15.5% ] 15.21% | 1,528,768 | 50.1% |
[ 15.5% - 16.0% ] 15.76% | 1,835,596 | 47.7% |
[ 16.0% - 16.5% ] 16.24% | 1,586,512 | 47.8% |
[ 16.5% - 17.0% ] 16.77% | 1,181,346 | 47.4% |
[ 17.0% - 17.5% ] 17.23% | 1,489,953 | 46.0% |
[ 17.5% - 18.0% ] 17.76% | 1,401,011 | 51.0% |
[ 18.0% - 18.5% ] 18.22% | 963,165 | 46.6% |
[ 18.5% - 19.0% ] 18.75% | 777,025 | 44.8% |
[ 19.0% - 19.5% ] 19.23% | 837,756 | 49.5% |
[ 19.5% - 20.0% ] 19.77% | 943,928 | 46.3% |
[ 20.0% - 20.5% ] 20.25% | 615,771 | 44.7% |
[ 20.5% - 21.0% ] 20.73% | 512,866 | 46.2% |
[ 21.0% - 21.5% ] 21.29% | 687,614 | 48.0% |
[ 21.5% - 22.0% ] 21.73% | 560,327 | 48.4% |
[ 22.0% - 22.5% ] 22.24% | 365,025 | 45.0% |
[ 22.5% - 23.0% ] 22.75% | 621,464 | 48.5% |
[ 23.0% - 23.5% ] 23.28% | 393,242 | 46.5% |
[ 23.5% - 24.0% ] 23.75% | 420,610 | 43.5% |
[ 24.0% - 24.5% ] 24.26% | 457,454 | 45.2% |
[ 24.5% - 25.0% ] 24.76% | 305,023 | 42.2% |
[ 25.0% - 25.5% ] 25.26% | 298,386 | 44.2% |
[ 25.5% - 26.0% ] 25.74% | 296,032 | 41.5% |
[ 26.0% - 26.5% ] 26.24% | 278,906 | 44.4% |
[ 26.5% - 27.0% ] 26.85% | 523,446 | 49.1% |
[ 27.0% - 27.5% ] 27.30% | 263,156 | 41.6% |
[ 27.5% - 28.0% ] 27.75% | 275,758 | 43.4% |
[ 28.0% - 28.5% ] 28.23% | 259,614 | 44.4% |
[ 28.5% - 29.0% ] 28.71% | 148,916 | 36.9% |
[ 29.0% - 29.5% ] 29.25% | 240,340 | 39.3% |
[ 29.5% - 30.0% ] 29.72% | 188,279 | 44.8% |
[ 30.0% - 30.5% ] 30.28% | 118,301 | 43.3% |
[ 30.5% - 31.0% ] 30.75% | 258,633 | 45.5% |
[ 31.0% - 31.5% ] 31.24% | 134,573 | 38.0% |
[ 31.5% - 32.0% ] 31.72% | 81,723 | 43.4% |
[ 32.0% - 32.5% ] 32.25% | 251,902 | 45.5% |
[ 32.5% - 33.0% ] 32.76% | 109,757 | 52.8% |
[ 33.0% - 33.5% ] 33.21% | 102,976 | 40.0% |
[ 33.5% - 34.0% ] 33.73% | 90,845 | 40.3% |
[ 34.0% - 34.5% ] 34.22% | 53,396 | 40.2% |
[ 34.5% - 35.0% ] 34.75% | 98,772 | 42.5% |
[ 35.0% - 35.5% ] 35.16% | 54,931 | 41.4% |
[ 35.5% - 36.0% ] 35.77% | 118,795 | 36.6% |
[ 36.0% - 36.5% ] 36.27% | 130,872 | 41.4% |
[ 36.5% - 37.0% ] 36.80% | 55,926 | 44.2% |
[ 37.0% - 37.5% ] 37.21% | 65,100 | 36.3% |
[ 37.5% - 38.0% ] 37.71% | 87,974 | 42.2% |
[ 38.0% - 38.5% ] 38.24% | 45,884 | 40.1% |
[ 38.5% - 39.0% ] 38.72% | 49,520 | 38.0% |
[ 39.0% - 39.5% ] 39.35% | 73,059 | 40.7% |
[ 39.5% - 40.0% ] 39.78% | 56,275 | 33.4% |
[ 40.0% - 40.5% ] 40.33% | 26,466 | 37.5% |
[ 40.5% - 41.0% ] 40.79% | 34,715 | 36.7% |
[ 41.0% - 41.5% ] 41.28% | 42,152 | 33.7% |
[ 41.5% - 42.0% ] 41.66% | 31,429 | 38.4% |
[ 42.0% - 42.5% ] 42.24% | 28,381 | 31.7% |
[ 42.5% - 43.0% ] 42.71% | 21,463 | 44.1% |
[ 43.0% - 43.5% ] 43.22% | 54,722 | 38.3% |
[ 43.5% - 44.0% ] 43.86% | 40,591 | 37.5% |
[ 44.0% - 44.5% ] 44.26% | 17,111 | 35.0% |
[ 44.5% - 45.0% ] 44.76% | 37,786 | 37.8% |
[ 45.0% - 45.5% ] 45.18% | 13,814 | 42.0% |
[ 45.5% - 46.0% ] 45.74% | 24,974 | 37.9% |
[ 46.0% - 46.5% ] 46.34% | 14,507 | 32.5% |
[ 46.5% - 47.0% ] 46.78% | 4,318 | 34.3% |
[ 47.0% - 47.5% ] 47.14% | 33,616 | 37.3% |
[ 47.5% - 48.0% ] 47.75% | 10,862 | 29.0% |
[ 48.0% - 48.5% ] 48.28% | 25,867 | 38.7% |
[ 48.5% - 49.0% ] 48.68% | 9,158 | 30.8% |
[ 49.0% - 49.5% ] 49.37% | 17,082 | 38.2% |
[ 49.5% - 50.0% ] 49.74% | 18,823 | 28.0% |
[ 50.0% - 50.5% ] 50.30% | 22,642 | 25.2% |
[ 50.5% - 51.0% ] 50.82% | 5,683 | 32.9% |
[ 51.0% - 51.5% ] 51.30% | 6,988 | 29.5% |
[ 51.5% - 52.0% ] 51.65% | 15,815 | 30.8% |
[ 52.0% - 52.5% ] 52.21% | 13,488 | 34.8% |
[ 52.5% - 53.0% ] 52.56% | 19,671 | 80.1% |
[ 53.0% - 53.5% ] 53.29% | 16,300 | 34.4% |
[ 53.5% - 54.0% ] 53.77% | 3,041 | 33.5% |
[ 54.0% - 54.5% ] 54.30% | 2,744 | 41.0% |
[ 54.5% - 55.0% ] 54.62% | 10,786 | 30.6% |
[ 55.0% - 55.5% ] 55.22% | 3,633 | 42.0% |
[ 55.5% - 56.0% ] 55.67% | 4,719 | 40.0% |
[ 56.0% - 56.5% ] 56.12% | 9,392 | 34.7% |
[ 56.5% - 57.0% ] 56.80% | 17,325 | 36.4% |
[ 57.0% - 57.5% ] 57.26% | 2,148 | 28.9% |
[ 57.5% - 58.0% ] 57.79% | 1,329 | 46.9% |
[ 58.0% - 58.5% ] 58.18% | 2,140 | 23.8% |
[ 58.5% - 59.0% ] 58.76% | 11,449 | 36.9% |
[ 59.0% - 59.5% ] 59.13% | 1,128 | 40.1% |
[ 59.5% - 60.0% ] 59.72% | 2,932 | 38.1% |
[ 60.0% - 60.5% ] 60.26% | 5,690 | 35.9% |
[ 60.5% - 61.0% ] 60.75% | 3,065 | 38.8% |
[ 61.0% - 61.5% ] 61.18% | 1,118 | 39.1% |
[ 61.5% - 62.0% ] 61.70% | 6,926 | 40.8% |
[ 62.0% - 62.5% ] 62.24% | 3,207 | 27.9% |
[ 62.5% - 63.0% ] 62.93% | 3,356 | 29.6% |
[ 63.0% - 63.5% ] 63.26% | 6,274 | 42.2% |
[ 63.5% - 64.0% ] 63.87% | 2,336 | 20.1% |
[ 64.0% - 64.5% ] 64.21% | 461 | 45.4% |
[ 64.5% - 65.0% ] 64.83% | 2,525 | 30.2% |
[ 65.5% - 66.0% ] 65.80% | 810 | 34.2% |
[ 66.0% - 66.5% ] 66.27% | 83 | 18.0% |
[ 66.5% - 67.0% ] 66.80% | 1,961 | 20.6% |
[ 67.0% - 67.5% ] 67.16% | 5,122 | 42.2% |
[ 67.5% - 68.0% ] 67.67% | 2,592 | 20.1% |
[ 68.0% - 68.5% ] 68.41% | 1,431 | 69.1% |
[ 68.5% - 69.0% ] 68.82% | 170 | 39.9% |
[ 69.5% - 70.0% ] 69.57% | 2,984 | 37.3% |
[ 70.0% - 70.5% ] 70.26% | 817 | 53.6% |
[ 70.5% - 71.0% ] 70.78% | 1,225 | 45.2% |
[ 71.0% - 71.5% ] 71.36% | 646 | 12.7% |
[ 71.5% - 72.0% ] 71.71% | 608 | 41.7% |
[ 72.0% - 72.5% ] 72.44% | 2,449 | 37.7% |
[ 72.5% - 73.0% ] 72.55% | 51 | 15.7% |
[ 73.0% - 73.5% ] 73.32% | 1,087 | 28.2% |
[ 73.5% - 74.0% ] 73.91% | 1,556 | 44.6% |
[ 74.0% - 74.5% ] 74.29% | 700 | 57.3% |
[ 74.5% - 75.0% ] 74.69% | 1,774 | 30.6% |
[ 75.0% - 75.5% ] 75.32% | 547 | 62.9% |
[ 75.5% - 76.0% ] 75.85% | 1,764 | 40.4% |
[ 76.0% - 76.5% ] 76.39% | 1,008 | 17.1% |
[ 76.5% - 77.0% ] 76.68% | 922 | 26.5% |
[ 77.0% - 77.5% ] 77.25% | 844 | 63.7% |
[ 77.5% - 78.0% ] 77.70% | 982 | 54.2% |
[ 78.0% - 78.5% ] 78.28% | 640 | 67.0% |
[ 78.5% - 79.0% ] 78.64% | 646 | 63.2% |
[ 79.0% - 79.5% ] 79.23% | 1,507 | 33.6% |
[ 79.5% - 80.0% ] 79.91% | 224 | 25.1% |
[ 80.5% - 81.0% ] 80.66% | 760 | 36.2% |
[ 81.5% - 82.0% ] 81.60% | 212 | 26.3% |
[ 82.0% - 82.5% ] 82.17% | 230 | 44.9% |
[ 83.0% - 83.5% ] 83.19% | 226 | 27.4% |
[ 84.5% - 85.0% ] 84.72% | 144 | 33.1% |
[ 85.5% - 86.0% ] 85.51% | 690 | 8.0% |
[ 86.5% - 87.0% ] 86.57% | 216 | 48.0% |
[ 87.0% - 87.5% ] 87.50% | 16 | 62.5% |
[ 88.0% - 88.5% ] 88.10% | 462 | 61.5% |
[ 88.5% - 89.0% ] 88.73% | 71 | 58.7% |
[ 89.0% - 89.5% ] 89.29% | 56 | 38.2% |
[ 91.0% - 91.5% ] 91.48% | 493 | 18.4% |
[ 91.5% - 92.0% ] 91.88% | 517 | 17.3% |
[ 92.5% - 93.0% ] 92.86% | 42 | 47.6% |
[ 93.5% - 94.0% ] 93.64% | 110 | 7.8% |
[ 97.5% - 98.0% ] 97.64% | 339 | 9.1% |
[ 99.5% - 100.0% ] 100.00% | 2,370 | 61.7% |