Iraqi College, 1 year or more
COMPARE
Iraqi
Select to Compare
College, 1 year or more
Iraqi College, 1 year or more
60.7%
COLLEGE, 1 YEAR OR MORE
83.3/ 100
METRIC RATING
140th/ 347
METRIC RANK
Iraqi College, 1 year or more Correlation Chart
The statistical analysis conducted on geographies consisting of 170,654,197 people shows a weak negative correlation between the proportion of Iraqis and percentage of population with at least college, 1 year or more education in the United States with a correlation coefficient (R) of -0.228 and weighted average of 60.7%. On average, for every 1% (one percent) increase in Iraqis within a typical geography, there is a decrease of 1.1% in percentage of population with at least college, 1 year or more education.
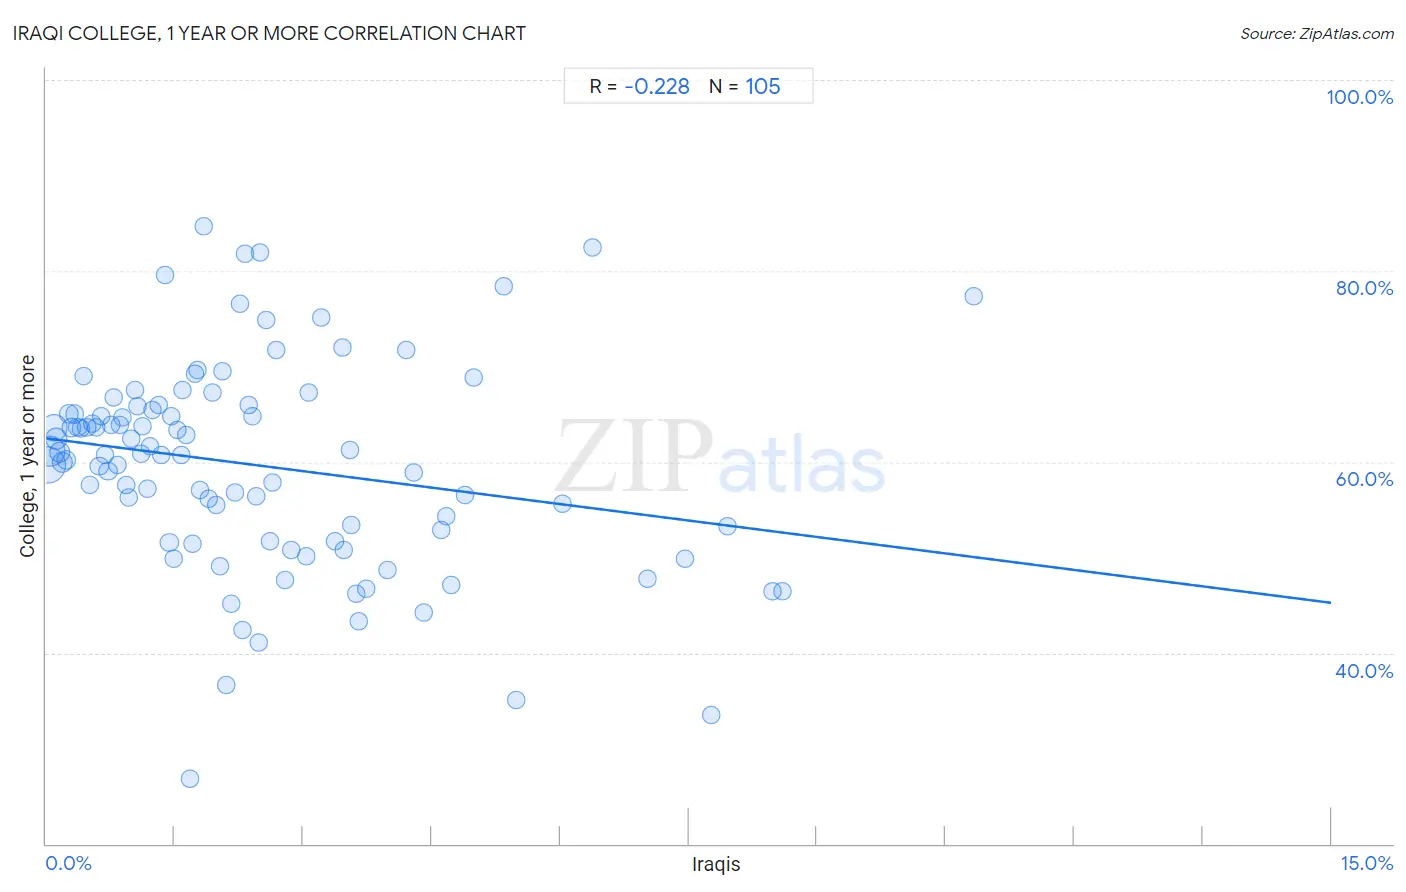
It is essential to understand that the correlation between the percentage of Iraqis and percentage of population with at least college, 1 year or more education does not imply a direct cause-and-effect relationship. It remains uncertain whether the presence of Iraqis influences an upward or downward trend in the level of percentage of population with at least college, 1 year or more education within an area, or if Iraqis simply ended up residing in those areas with higher or lower levels of percentage of population with at least college, 1 year or more education due to other factors.
Demographics Similar to Iraqis by College, 1 year or more
In terms of college, 1 year or more, the demographic groups most similar to Iraqis are Immigrants from Afghanistan (60.7%, a difference of 0.020%), Polish (60.7%, a difference of 0.050%), Canadian (60.6%, a difference of 0.050%), Immigrants from Eritrea (60.7%, a difference of 0.090%), and Taiwanese (60.7%, a difference of 0.10%).
| Demographics | Rating | Rank | College, 1 year or more |
| Immigrants from Uzbekistan | 88.0 /100 | #133 | Excellent 61.0% |
| Immigrants from Venezuela | 87.9 /100 | #134 | Excellent 61.0% |
| Immigrants from Uganda | 87.4 /100 | #135 | Excellent 60.9% |
| Basques | 87.2 /100 | #136 | Excellent 60.9% |
| Slovenes | 86.5 /100 | #137 | Excellent 60.9% |
| Taiwanese | 84.3 /100 | #138 | Excellent 60.7% |
| Immigrants from Eritrea | 84.3 /100 | #139 | Excellent 60.7% |
| Iraqis | 83.3 /100 | #140 | Excellent 60.7% |
| Immigrants from Afghanistan | 83.1 /100 | #141 | Excellent 60.7% |
| Poles | 82.8 /100 | #142 | Excellent 60.7% |
| Canadians | 82.7 /100 | #143 | Excellent 60.6% |
| Czechs | 81.9 /100 | #144 | Excellent 60.6% |
| Slavs | 81.1 /100 | #145 | Excellent 60.6% |
| Scottish | 80.2 /100 | #146 | Excellent 60.5% |
| Immigrants from Kenya | 79.1 /100 | #147 | Good 60.5% |
Iraqi College, 1 year or more Correlation Summary
| Measurement | Iraqi Data | College, 1 year or more Data |
| Minimum | 0.019% | 26.8% |
| Maximum | 10.8% | 84.7% |
| Range | 10.8% | 57.8% |
| Mean | 2.5% | 59.6% |
| Median | 1.9% | 60.8% |
| Interquartile 25% (IQ1) | 0.91% | 51.7% |
| Interquartile 75% (IQ3) | 3.5% | 65.6% |
| Interquartile Range (IQR) | 2.6% | 13.9% |
| Standard Deviation (Sample) | 2.2% | 10.9% |
| Standard Deviation (Population) | 2.1% | 10.8% |
Correlation Details
| Iraqi Percentile | Sample Size | College, 1 year or more |
[ 0.0% - 0.5% ] 0.019% | 54,084,025 | 59.7% |
[ 0.0% - 0.5% ] 0.049% | 36,572,847 | 61.2% |
[ 0.0% - 0.5% ] 0.086% | 24,056,494 | 63.6% |
[ 0.0% - 0.5% ] 0.12% | 10,913,583 | 62.4% |
[ 0.0% - 0.5% ] 0.16% | 8,577,197 | 61.0% |
[ 0.0% - 0.5% ] 0.19% | 8,017,353 | 60.0% |
[ 0.0% - 0.5% ] 0.23% | 3,922,848 | 60.2% |
[ 0.0% - 0.5% ] 0.26% | 3,096,854 | 65.0% |
[ 0.0% - 0.5% ] 0.30% | 3,049,130 | 63.6% |
[ 0.0% - 0.5% ] 0.33% | 1,881,368 | 65.0% |
[ 0.0% - 0.5% ] 0.37% | 1,613,628 | 63.6% |
[ 0.0% - 0.5% ] 0.40% | 1,976,525 | 63.5% |
[ 0.0% - 0.5% ] 0.44% | 1,014,488 | 69.0% |
[ 0.0% - 0.5% ] 0.47% | 853,984 | 63.6% |
[ 0.5% - 1.0% ] 0.51% | 759,550 | 57.5% |
[ 0.5% - 1.0% ] 0.54% | 834,900 | 64.0% |
[ 0.5% - 1.0% ] 0.58% | 637,468 | 63.6% |
[ 0.5% - 1.0% ] 0.62% | 727,296 | 59.6% |
[ 0.5% - 1.0% ] 0.65% | 480,757 | 64.7% |
[ 0.5% - 1.0% ] 0.68% | 209,573 | 60.7% |
[ 0.5% - 1.0% ] 0.72% | 456,261 | 59.1% |
[ 0.5% - 1.0% ] 0.76% | 509,707 | 63.9% |
[ 0.5% - 1.0% ] 0.78% | 357,366 | 66.7% |
[ 0.5% - 1.0% ] 0.83% | 373,998 | 59.7% |
[ 0.5% - 1.0% ] 0.86% | 572,582 | 63.9% |
[ 0.5% - 1.0% ] 0.89% | 353,586 | 64.7% |
[ 0.5% - 1.0% ] 0.93% | 116,639 | 57.6% |
[ 0.5% - 1.0% ] 0.97% | 129,825 | 56.2% |
[ 0.5% - 1.0% ] 0.99% | 217,585 | 62.4% |
[ 1.0% - 1.5% ] 1.03% | 109,833 | 67.5% |
[ 1.0% - 1.5% ] 1.07% | 188,029 | 65.8% |
[ 1.0% - 1.5% ] 1.11% | 164,461 | 60.8% |
[ 1.0% - 1.5% ] 1.13% | 40,722 | 63.7% |
[ 1.0% - 1.5% ] 1.18% | 272,844 | 57.2% |
[ 1.0% - 1.5% ] 1.21% | 155,660 | 61.6% |
[ 1.0% - 1.5% ] 1.24% | 138,598 | 65.5% |
[ 1.0% - 1.5% ] 1.31% | 54,393 | 65.9% |
[ 1.0% - 1.5% ] 1.34% | 88,414 | 60.8% |
[ 1.0% - 1.5% ] 1.39% | 14,189 | 79.6% |
[ 1.0% - 1.5% ] 1.44% | 57,825 | 51.5% |
[ 1.0% - 1.5% ] 1.46% | 76,757 | 64.8% |
[ 1.0% - 1.5% ] 1.49% | 182,183 | 49.8% |
[ 1.5% - 2.0% ] 1.53% | 394,812 | 63.3% |
[ 1.5% - 2.0% ] 1.57% | 121,760 | 60.7% |
[ 1.5% - 2.0% ] 1.59% | 43,520 | 67.5% |
[ 1.5% - 2.0% ] 1.63% | 89,710 | 62.8% |
[ 1.5% - 2.0% ] 1.67% | 7,534 | 26.8% |
[ 1.5% - 2.0% ] 1.70% | 37,704 | 51.4% |
[ 1.5% - 2.0% ] 1.73% | 35,415 | 69.3% |
[ 1.5% - 2.0% ] 1.77% | 153,050 | 69.6% |
[ 1.5% - 2.0% ] 1.80% | 44,873 | 57.0% |
[ 1.5% - 2.0% ] 1.84% | 9,722 | 84.7% |
[ 1.5% - 2.0% ] 1.90% | 40,923 | 56.1% |
[ 1.5% - 2.0% ] 1.94% | 63,109 | 67.3% |
[ 1.5% - 2.0% ] 1.99% | 36,685 | 55.5% |
[ 2.0% - 2.5% ] 2.02% | 29,673 | 49.1% |
[ 2.0% - 2.5% ] 2.06% | 76,047 | 69.5% |
[ 2.0% - 2.5% ] 2.10% | 39,831 | 36.6% |
[ 2.0% - 2.5% ] 2.16% | 12,292 | 45.1% |
[ 2.0% - 2.5% ] 2.20% | 32,958 | 56.8% |
[ 2.0% - 2.5% ] 2.26% | 44,206 | 76.5% |
[ 2.0% - 2.5% ] 2.29% | 19,289 | 42.4% |
[ 2.0% - 2.5% ] 2.33% | 34,222 | 81.8% |
[ 2.0% - 2.5% ] 2.37% | 23,867 | 66.0% |
[ 2.0% - 2.5% ] 2.41% | 22,914 | 64.8% |
[ 2.0% - 2.5% ] 2.45% | 34,375 | 56.4% |
[ 2.0% - 2.5% ] 2.49% | 22,082 | 41.0% |
[ 2.0% - 2.5% ] 2.49% | 5,298 | 81.9% |
[ 2.5% - 3.0% ] 2.57% | 17,007 | 74.9% |
[ 2.5% - 3.0% ] 2.61% | 29,075 | 51.6% |
[ 2.5% - 3.0% ] 2.64% | 61,381 | 57.8% |
[ 2.5% - 3.0% ] 2.68% | 81,232 | 71.7% |
[ 2.5% - 3.0% ] 2.78% | 30,590 | 47.7% |
[ 2.5% - 3.0% ] 2.86% | 105 | 50.7% |
[ 3.0% - 3.5% ] 3.03% | 15,387 | 50.1% |
[ 3.0% - 3.5% ] 3.06% | 2,388 | 67.3% |
[ 3.0% - 3.5% ] 3.22% | 45,692 | 75.1% |
[ 3.0% - 3.5% ] 3.37% | 267 | 51.7% |
[ 3.0% - 3.5% ] 3.45% | 14,997 | 72.0% |
[ 3.0% - 3.5% ] 3.48% | 27,848 | 50.8% |
[ 3.5% - 4.0% ] 3.54% | 16,469 | 61.2% |
[ 3.5% - 4.0% ] 3.56% | 36,101 | 53.4% |
[ 3.5% - 4.0% ] 3.62% | 15,017 | 46.2% |
[ 3.5% - 4.0% ] 3.65% | 1,368 | 43.3% |
[ 3.5% - 4.0% ] 3.74% | 4,092 | 46.7% |
[ 3.5% - 4.0% ] 3.98% | 6,607 | 48.6% |
[ 4.0% - 4.5% ] 4.20% | 15,826 | 71.7% |
[ 4.0% - 4.5% ] 4.28% | 45,937 | 58.9% |
[ 4.0% - 4.5% ] 4.40% | 16,850 | 44.2% |
[ 4.5% - 5.0% ] 4.61% | 147,500 | 52.9% |
[ 4.5% - 5.0% ] 4.67% | 214 | 54.3% |
[ 4.5% - 5.0% ] 4.73% | 69,638 | 47.2% |
[ 4.5% - 5.0% ] 4.89% | 108,414 | 56.6% |
[ 4.5% - 5.0% ] 4.99% | 22,430 | 68.8% |
[ 5.0% - 5.5% ] 5.34% | 8,277 | 78.3% |
[ 5.0% - 5.5% ] 5.49% | 164 | 35.1% |
[ 6.0% - 6.5% ] 6.02% | 79,216 | 55.6% |
[ 6.0% - 6.5% ] 6.38% | 11,265 | 82.4% |
[ 7.0% - 7.5% ] 7.02% | 105,721 | 47.7% |
[ 7.0% - 7.5% ] 7.46% | 59,775 | 49.8% |
[ 7.5% - 8.0% ] 7.77% | 309 | 33.5% |
[ 7.5% - 8.0% ] 7.95% | 40,392 | 53.3% |
[ 8.0% - 8.5% ] 8.48% | 43,232 | 46.4% |
[ 8.5% - 9.0% ] 8.60% | 53,044 | 46.4% |
[ 10.5% - 11.0% ] 10.82% | 33,174 | 77.3% |