Guamanian/Chamorro vs Hispanic or Latino College, 1 year or more
COMPARE
Guamanian/Chamorro
Hispanic or Latino
College, 1 year or more
College, 1 year or more Comparison
Guamanians/Chamorros
Hispanics or Latinos
58.6%
COLLEGE, 1 YEAR OR MORE
26.2/ 100
METRIC RATING
196th/ 347
METRIC RANK
51.1%
COLLEGE, 1 YEAR OR MORE
0.0/ 100
METRIC RATING
317th/ 347
METRIC RANK
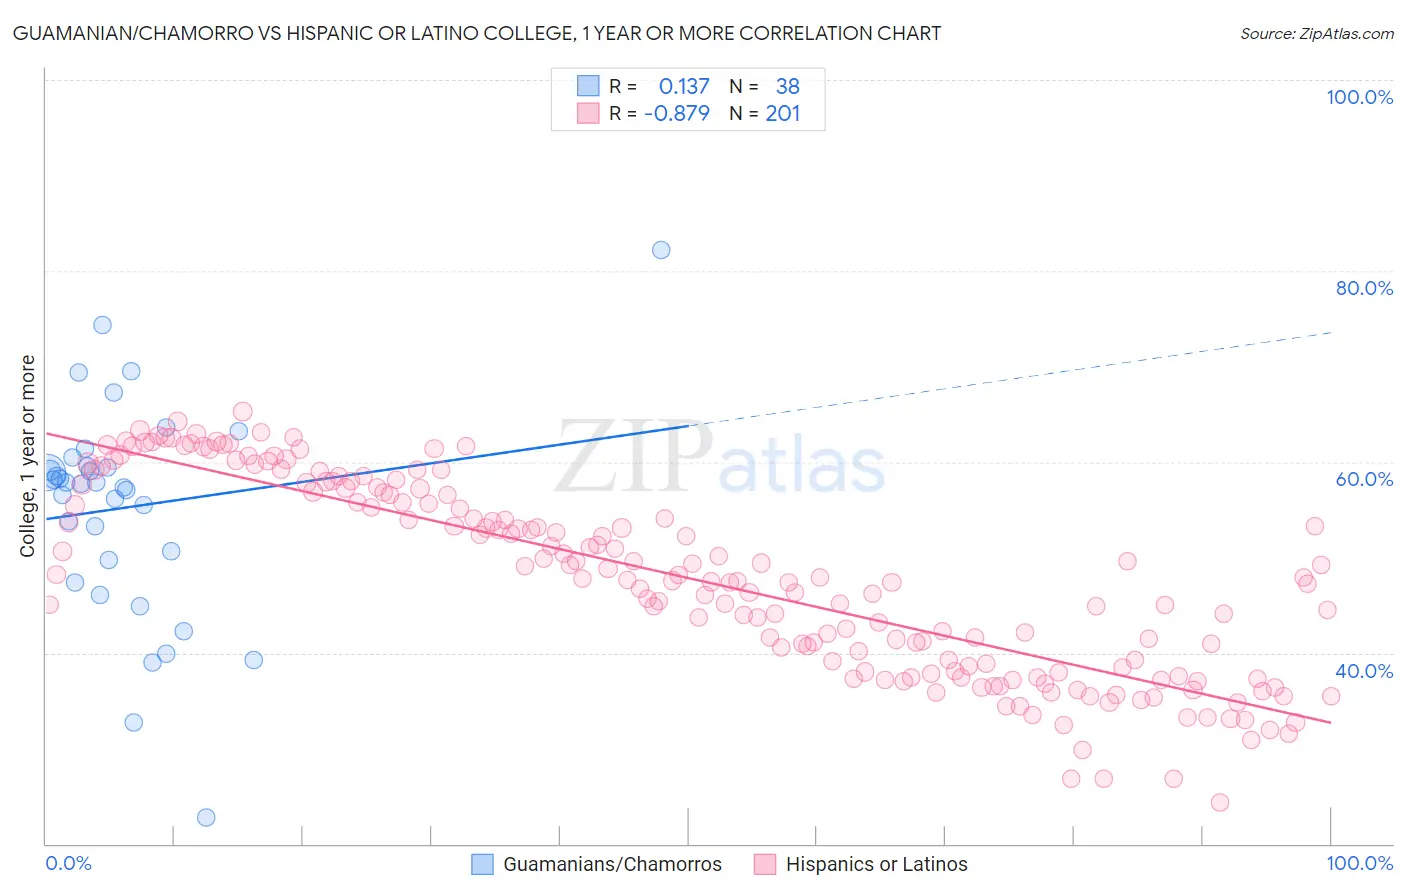
Guamanian/Chamorro vs Hispanic or Latino College, 1 year or more Correlation Chart
The statistical analysis conducted on geographies consisting of 221,965,751 people shows a poor positive correlation between the proportion of Guamanians/Chamorros and percentage of population with at least college, 1 year or more education in the United States with a correlation coefficient (R) of 0.137 and weighted average of 58.6%. Similarly, the statistical analysis conducted on geographies consisting of 578,586,619 people shows a very strong negative correlation between the proportion of Hispanics or Latinos and percentage of population with at least college, 1 year or more education in the United States with a correlation coefficient (R) of -0.879 and weighted average of 51.1%, a difference of 14.6%.
College, 1 year or more Correlation Summary
| Measurement | Guamanian/Chamorro | Hispanic or Latino |
| Minimum | 22.8% | 24.4% |
| Maximum | 82.3% | 65.3% |
| Range | 59.5% | 40.9% |
| Mean | 55.2% | 47.8% |
| Median | 57.7% | 47.8% |
| Interquartile 25% (IQ1) | 49.7% | 38.2% |
| Interquartile 75% (IQ3) | 59.5% | 57.0% |
| Interquartile Range (IQR) | 9.9% | 18.8% |
| Standard Deviation (Sample) | 11.3% | 10.0% |
| Standard Deviation (Population) | 11.2% | 10.0% |
Similar Demographics by College, 1 year or more
Demographics Similar to Guamanians/Chamorros by College, 1 year or more
In terms of college, 1 year or more, the demographic groups most similar to Guamanians/Chamorros are Dutch (58.6%, a difference of 0.0%), Immigrants from Thailand (58.6%, a difference of 0.010%), Costa Rican (58.6%, a difference of 0.020%), Immigrants from South Eastern Asia (58.5%, a difference of 0.080%), and Peruvian (58.6%, a difference of 0.090%).
| Demographics | Rating | Rank | College, 1 year or more |
| Uruguayans | 31.8 /100 | #189 | Fair 58.8% |
| Immigrants | Cameroon | 31.2 /100 | #190 | Fair 58.8% |
| Immigrants | Philippines | 29.2 /100 | #191 | Fair 58.7% |
| Colombians | 27.6 /100 | #192 | Fair 58.7% |
| Peruvians | 27.5 /100 | #193 | Fair 58.6% |
| Costa Ricans | 26.4 /100 | #194 | Fair 58.6% |
| Dutch | 26.2 /100 | #195 | Fair 58.6% |
| Guamanians/Chamorros | 26.2 /100 | #196 | Fair 58.6% |
| Immigrants | Thailand | 26.0 /100 | #197 | Fair 58.6% |
| Immigrants | South Eastern Asia | 25.1 /100 | #198 | Fair 58.5% |
| Slovaks | 24.6 /100 | #199 | Fair 58.5% |
| Spanish | 24.2 /100 | #200 | Fair 58.5% |
| Nigerians | 23.0 /100 | #201 | Fair 58.5% |
| Immigrants | South America | 21.9 /100 | #202 | Fair 58.4% |
| Ghanaians | 20.9 /100 | #203 | Fair 58.4% |
Demographics Similar to Hispanics or Latinos by College, 1 year or more
In terms of college, 1 year or more, the demographic groups most similar to Hispanics or Latinos are Cajun (51.2%, a difference of 0.090%), Immigrants from Honduras (51.0%, a difference of 0.13%), Guatemalan (51.2%, a difference of 0.16%), Immigrants from El Salvador (51.0%, a difference of 0.22%), and Kiowa (51.0%, a difference of 0.28%).
| Demographics | Rating | Rank | College, 1 year or more |
| Hondurans | 0.0 /100 | #310 | Tragic 51.6% |
| Immigrants | Haiti | 0.0 /100 | #311 | Tragic 51.5% |
| Pueblo | 0.0 /100 | #312 | Tragic 51.5% |
| Immigrants | Caribbean | 0.0 /100 | #313 | Tragic 51.4% |
| Fijians | 0.0 /100 | #314 | Tragic 51.3% |
| Guatemalans | 0.0 /100 | #315 | Tragic 51.2% |
| Cajuns | 0.0 /100 | #316 | Tragic 51.2% |
| Hispanics or Latinos | 0.0 /100 | #317 | Tragic 51.1% |
| Immigrants | Honduras | 0.0 /100 | #318 | Tragic 51.0% |
| Immigrants | El Salvador | 0.0 /100 | #319 | Tragic 51.0% |
| Kiowa | 0.0 /100 | #320 | Tragic 51.0% |
| Hopi | 0.0 /100 | #321 | Tragic 50.9% |
| Navajo | 0.0 /100 | #322 | Tragic 50.8% |
| Immigrants | Guatemala | 0.0 /100 | #323 | Tragic 50.7% |
| Immigrants | Cuba | 0.0 /100 | #324 | Tragic 50.7% |