Guamanian/Chamorro vs Russian College, 1 year or more
COMPARE
Guamanian/Chamorro
Russian
College, 1 year or more
College, 1 year or more Comparison
Guamanians/Chamorros
Russians
58.6%
COLLEGE, 1 YEAR OR MORE
26.2/ 100
METRIC RATING
196th/ 347
METRIC RANK
65.1%
COLLEGE, 1 YEAR OR MORE
99.9/ 100
METRIC RATING
37th/ 347
METRIC RANK
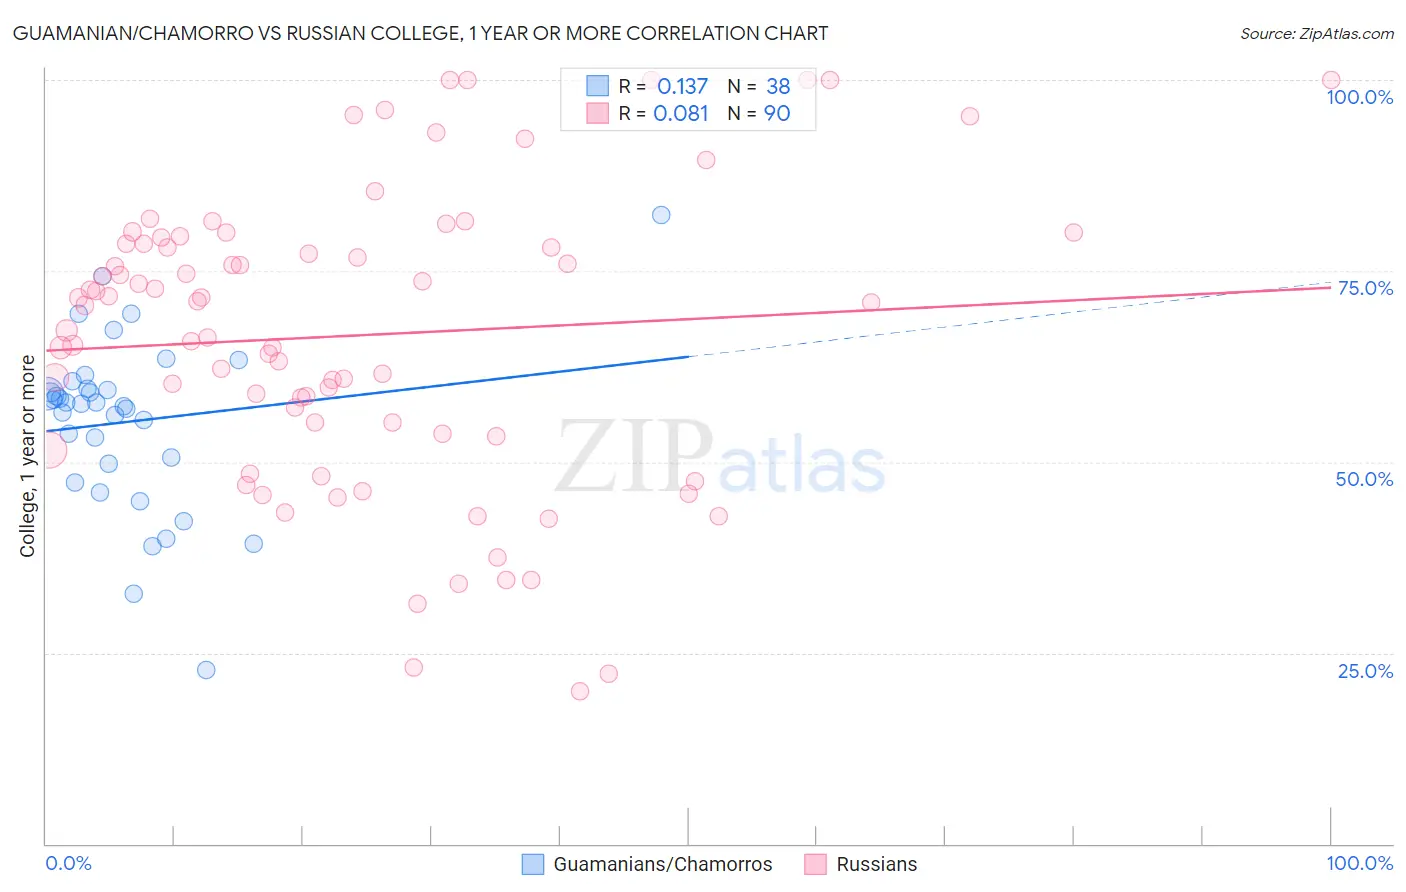
Guamanian/Chamorro vs Russian College, 1 year or more Correlation Chart
The statistical analysis conducted on geographies consisting of 221,965,751 people shows a poor positive correlation between the proportion of Guamanians/Chamorros and percentage of population with at least college, 1 year or more education in the United States with a correlation coefficient (R) of 0.137 and weighted average of 58.6%. Similarly, the statistical analysis conducted on geographies consisting of 512,253,634 people shows a slight positive correlation between the proportion of Russians and percentage of population with at least college, 1 year or more education in the United States with a correlation coefficient (R) of 0.081 and weighted average of 65.1%, a difference of 11.2%.
College, 1 year or more Correlation Summary
| Measurement | Guamanian/Chamorro | Russian |
| Minimum | 22.8% | 20.0% |
| Maximum | 82.3% | 100.0% |
| Range | 59.5% | 80.0% |
| Mean | 55.2% | 66.6% |
| Median | 57.7% | 70.6% |
| Interquartile 25% (IQ1) | 49.7% | 53.7% |
| Interquartile 75% (IQ3) | 59.5% | 78.6% |
| Interquartile Range (IQR) | 9.9% | 24.9% |
| Standard Deviation (Sample) | 11.3% | 19.2% |
| Standard Deviation (Population) | 11.2% | 19.1% |
Similar Demographics by College, 1 year or more
Demographics Similar to Guamanians/Chamorros by College, 1 year or more
In terms of college, 1 year or more, the demographic groups most similar to Guamanians/Chamorros are Dutch (58.6%, a difference of 0.0%), Immigrants from Thailand (58.6%, a difference of 0.010%), Costa Rican (58.6%, a difference of 0.020%), Immigrants from South Eastern Asia (58.5%, a difference of 0.080%), and Peruvian (58.6%, a difference of 0.090%).
| Demographics | Rating | Rank | College, 1 year or more |
| Uruguayans | 31.8 /100 | #189 | Fair 58.8% |
| Immigrants | Cameroon | 31.2 /100 | #190 | Fair 58.8% |
| Immigrants | Philippines | 29.2 /100 | #191 | Fair 58.7% |
| Colombians | 27.6 /100 | #192 | Fair 58.7% |
| Peruvians | 27.5 /100 | #193 | Fair 58.6% |
| Costa Ricans | 26.4 /100 | #194 | Fair 58.6% |
| Dutch | 26.2 /100 | #195 | Fair 58.6% |
| Guamanians/Chamorros | 26.2 /100 | #196 | Fair 58.6% |
| Immigrants | Thailand | 26.0 /100 | #197 | Fair 58.6% |
| Immigrants | South Eastern Asia | 25.1 /100 | #198 | Fair 58.5% |
| Slovaks | 24.6 /100 | #199 | Fair 58.5% |
| Spanish | 24.2 /100 | #200 | Fair 58.5% |
| Nigerians | 23.0 /100 | #201 | Fair 58.5% |
| Immigrants | South America | 21.9 /100 | #202 | Fair 58.4% |
| Ghanaians | 20.9 /100 | #203 | Fair 58.4% |
Demographics Similar to Russians by College, 1 year or more
In terms of college, 1 year or more, the demographic groups most similar to Russians are Immigrants from South Africa (65.1%, a difference of 0.010%), Immigrants from Turkey (65.2%, a difference of 0.090%), Immigrants from Saudi Arabia (65.0%, a difference of 0.15%), Estonian (65.0%, a difference of 0.22%), and Israeli (65.3%, a difference of 0.28%).
| Demographics | Rating | Rank | College, 1 year or more |
| Immigrants | Denmark | 100.0 /100 | #30 | Exceptional 65.6% |
| Turks | 100.0 /100 | #31 | Exceptional 65.5% |
| Bulgarians | 100.0 /100 | #32 | Exceptional 65.5% |
| Immigrants | Sri Lanka | 99.9 /100 | #33 | Exceptional 65.4% |
| Israelis | 99.9 /100 | #34 | Exceptional 65.3% |
| Immigrants | Turkey | 99.9 /100 | #35 | Exceptional 65.2% |
| Immigrants | South Africa | 99.9 /100 | #36 | Exceptional 65.1% |
| Russians | 99.9 /100 | #37 | Exceptional 65.1% |
| Immigrants | Saudi Arabia | 99.9 /100 | #38 | Exceptional 65.0% |
| Estonians | 99.9 /100 | #39 | Exceptional 65.0% |
| Immigrants | Kuwait | 99.9 /100 | #40 | Exceptional 65.0% |
| Mongolians | 99.9 /100 | #41 | Exceptional 64.8% |
| Immigrants | Latvia | 99.9 /100 | #42 | Exceptional 64.8% |
| Immigrants | Russia | 99.9 /100 | #43 | Exceptional 64.7% |
| Immigrants | Norway | 99.9 /100 | #44 | Exceptional 64.7% |