Guamanian/Chamorro vs Immigrants from Ireland College, 1 year or more
COMPARE
Guamanian/Chamorro
Immigrants from Ireland
College, 1 year or more
College, 1 year or more Comparison
Guamanians/Chamorros
Immigrants from Ireland
58.6%
COLLEGE, 1 YEAR OR MORE
26.2/ 100
METRIC RATING
196th/ 347
METRIC RANK
65.9%
COLLEGE, 1 YEAR OR MORE
100.0/ 100
METRIC RATING
27th/ 347
METRIC RANK
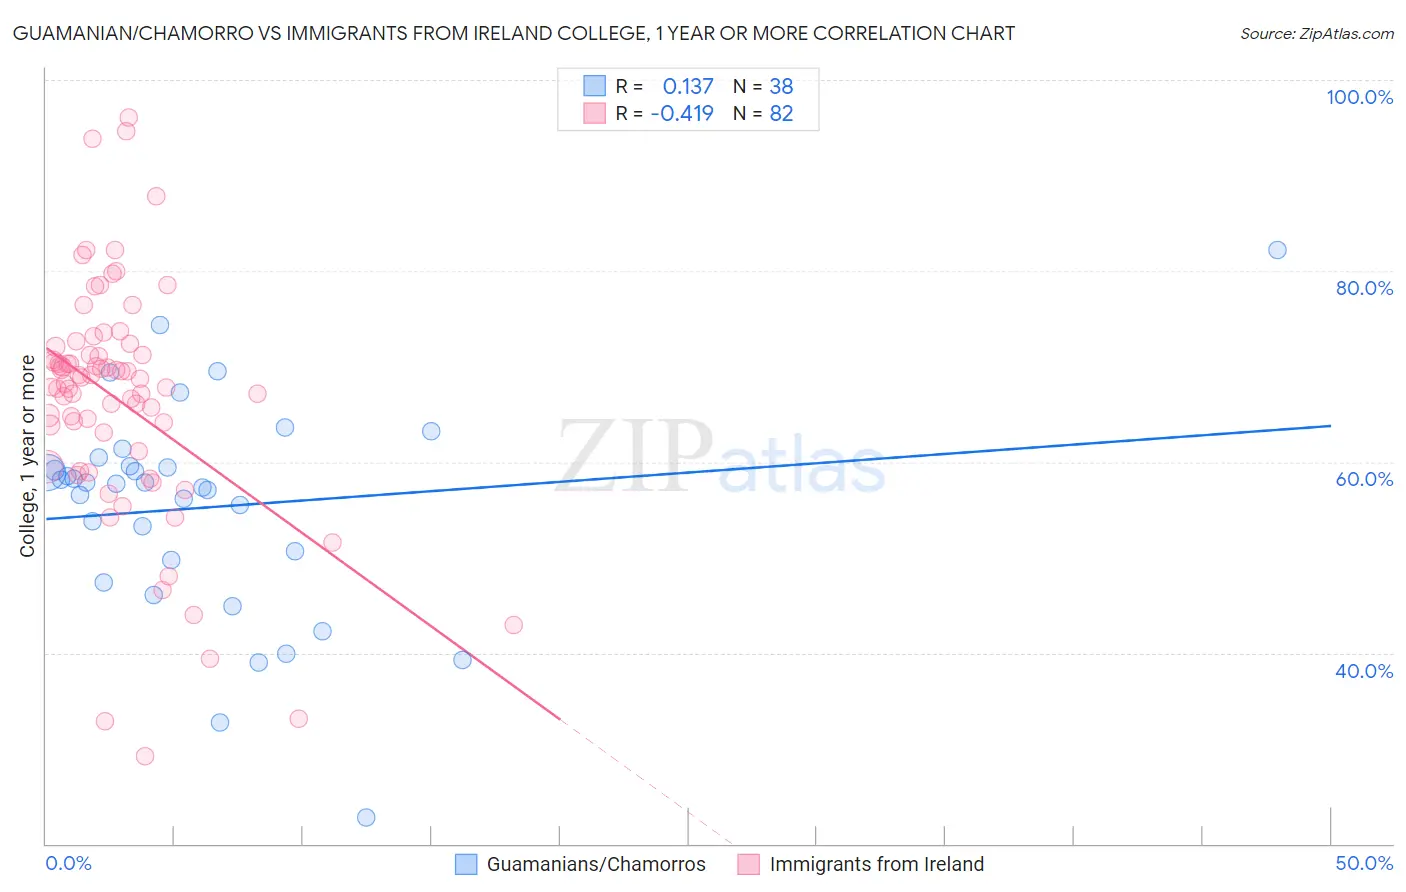
Guamanian/Chamorro vs Immigrants from Ireland College, 1 year or more Correlation Chart
The statistical analysis conducted on geographies consisting of 221,965,751 people shows a poor positive correlation between the proportion of Guamanians/Chamorros and percentage of population with at least college, 1 year or more education in the United States with a correlation coefficient (R) of 0.137 and weighted average of 58.6%. Similarly, the statistical analysis conducted on geographies consisting of 240,784,591 people shows a moderate negative correlation between the proportion of Immigrants from Ireland and percentage of population with at least college, 1 year or more education in the United States with a correlation coefficient (R) of -0.419 and weighted average of 65.9%, a difference of 12.5%.
College, 1 year or more Correlation Summary
| Measurement | Guamanian/Chamorro | Immigrants from Ireland |
| Minimum | 22.8% | 29.2% |
| Maximum | 82.3% | 96.0% |
| Range | 59.5% | 66.9% |
| Mean | 55.2% | 66.5% |
| Median | 57.7% | 68.4% |
| Interquartile 25% (IQ1) | 49.7% | 61.1% |
| Interquartile 75% (IQ3) | 59.5% | 71.3% |
| Interquartile Range (IQR) | 9.9% | 10.1% |
| Standard Deviation (Sample) | 11.3% | 12.4% |
| Standard Deviation (Population) | 11.2% | 12.4% |
Similar Demographics by College, 1 year or more
Demographics Similar to Guamanians/Chamorros by College, 1 year or more
In terms of college, 1 year or more, the demographic groups most similar to Guamanians/Chamorros are Dutch (58.6%, a difference of 0.0%), Immigrants from Thailand (58.6%, a difference of 0.010%), Costa Rican (58.6%, a difference of 0.020%), Immigrants from South Eastern Asia (58.5%, a difference of 0.080%), and Peruvian (58.6%, a difference of 0.090%).
| Demographics | Rating | Rank | College, 1 year or more |
| Uruguayans | 31.8 /100 | #189 | Fair 58.8% |
| Immigrants | Cameroon | 31.2 /100 | #190 | Fair 58.8% |
| Immigrants | Philippines | 29.2 /100 | #191 | Fair 58.7% |
| Colombians | 27.6 /100 | #192 | Fair 58.7% |
| Peruvians | 27.5 /100 | #193 | Fair 58.6% |
| Costa Ricans | 26.4 /100 | #194 | Fair 58.6% |
| Dutch | 26.2 /100 | #195 | Fair 58.6% |
| Guamanians/Chamorros | 26.2 /100 | #196 | Fair 58.6% |
| Immigrants | Thailand | 26.0 /100 | #197 | Fair 58.6% |
| Immigrants | South Eastern Asia | 25.1 /100 | #198 | Fair 58.5% |
| Slovaks | 24.6 /100 | #199 | Fair 58.5% |
| Spanish | 24.2 /100 | #200 | Fair 58.5% |
| Nigerians | 23.0 /100 | #201 | Fair 58.5% |
| Immigrants | South America | 21.9 /100 | #202 | Fair 58.4% |
| Ghanaians | 20.9 /100 | #203 | Fair 58.4% |
Demographics Similar to Immigrants from Ireland by College, 1 year or more
In terms of college, 1 year or more, the demographic groups most similar to Immigrants from Ireland are Immigrants from France (65.8%, a difference of 0.17%), Latvian (66.1%, a difference of 0.20%), Indian (Asian) (66.1%, a difference of 0.24%), Immigrants from Northern Europe (65.6%, a difference of 0.42%), and Immigrants from Denmark (65.6%, a difference of 0.53%).
| Demographics | Rating | Rank | College, 1 year or more |
| Immigrants | Korea | 100.0 /100 | #20 | Exceptional 66.5% |
| Immigrants | Hong Kong | 100.0 /100 | #21 | Exceptional 66.4% |
| Soviet Union | 100.0 /100 | #22 | Exceptional 66.4% |
| Immigrants | China | 100.0 /100 | #23 | Exceptional 66.4% |
| Immigrants | Belgium | 100.0 /100 | #24 | Exceptional 66.3% |
| Indians (Asian) | 100.0 /100 | #25 | Exceptional 66.1% |
| Latvians | 100.0 /100 | #26 | Exceptional 66.1% |
| Immigrants | Ireland | 100.0 /100 | #27 | Exceptional 65.9% |
| Immigrants | France | 100.0 /100 | #28 | Exceptional 65.8% |
| Immigrants | Northern Europe | 100.0 /100 | #29 | Exceptional 65.6% |
| Immigrants | Denmark | 100.0 /100 | #30 | Exceptional 65.6% |
| Turks | 100.0 /100 | #31 | Exceptional 65.5% |
| Bulgarians | 100.0 /100 | #32 | Exceptional 65.5% |
| Immigrants | Sri Lanka | 99.9 /100 | #33 | Exceptional 65.4% |
| Israelis | 99.9 /100 | #34 | Exceptional 65.3% |