Malaysian vs Paiute Disability
COMPARE
Malaysian
Paiute
Disability
Disability Comparison
Malaysians
Paiute
12.2%
DISABILITY
2.5/ 100
METRIC RATING
231st/ 347
METRIC RANK
13.9%
DISABILITY
0.0/ 100
METRIC RATING
321st/ 347
METRIC RANK
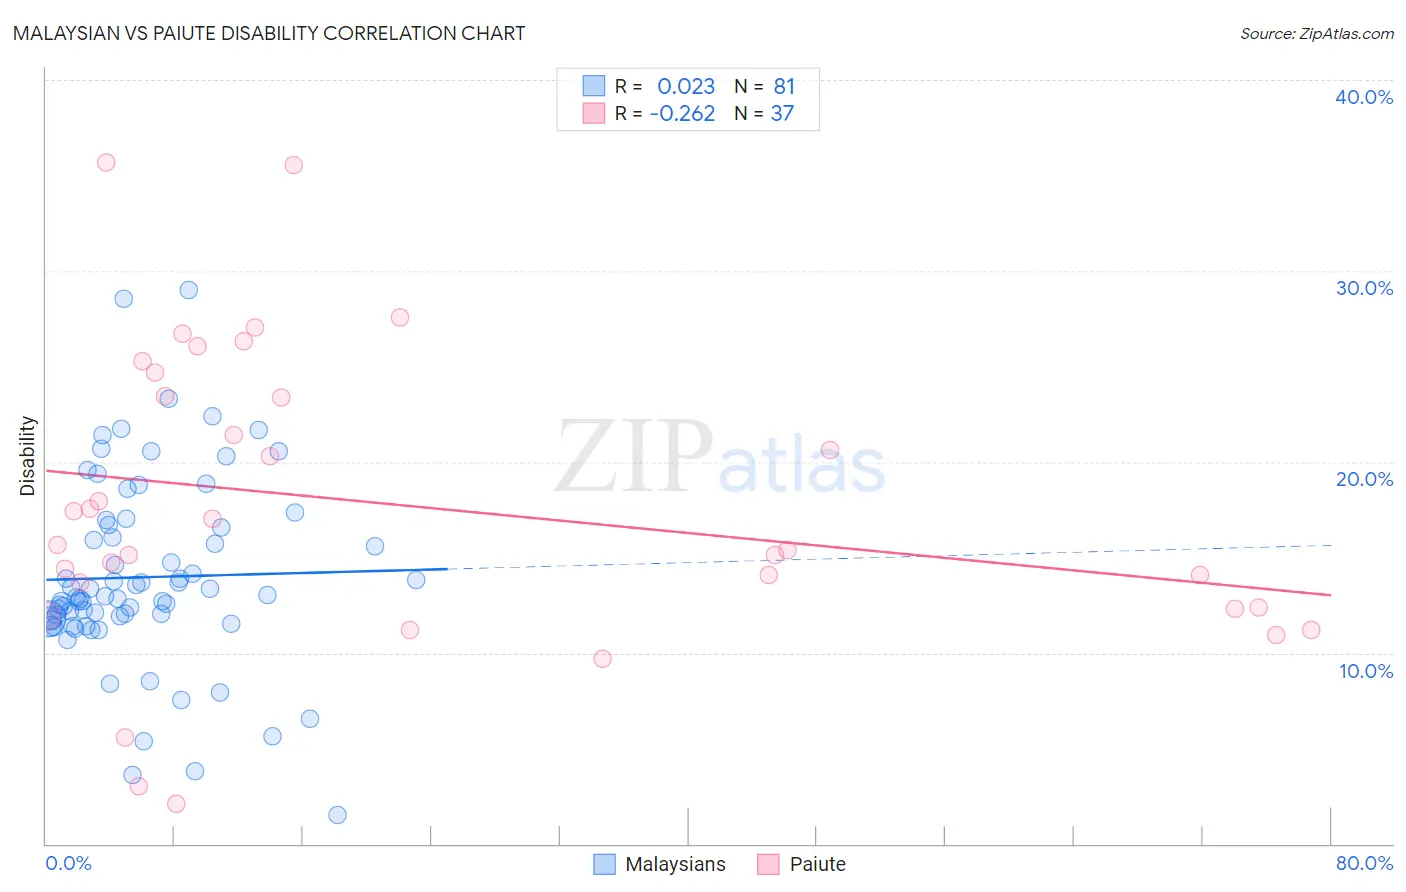
Malaysian vs Paiute Disability Correlation Chart
The statistical analysis conducted on geographies consisting of 226,067,054 people shows no correlation between the proportion of Malaysians and percentage of population with a disability in the United States with a correlation coefficient (R) of 0.023 and weighted average of 12.2%. Similarly, the statistical analysis conducted on geographies consisting of 58,394,773 people shows a weak negative correlation between the proportion of Paiute and percentage of population with a disability in the United States with a correlation coefficient (R) of -0.262 and weighted average of 13.9%, a difference of 14.0%.
Disability Correlation Summary
| Measurement | Malaysian | Paiute |
| Minimum | 1.5% | 2.1% |
| Maximum | 29.0% | 35.7% |
| Range | 27.5% | 33.6% |
| Mean | 14.0% | 17.7% |
| Median | 12.9% | 15.7% |
| Interquartile 25% (IQ1) | 11.8% | 12.3% |
| Interquartile 75% (IQ3) | 16.6% | 24.0% |
| Interquartile Range (IQR) | 4.9% | 11.7% |
| Standard Deviation (Sample) | 5.0% | 7.9% |
| Standard Deviation (Population) | 4.9% | 7.8% |
Similar Demographics by Disability
Demographics Similar to Malaysians by Disability
In terms of disability, the demographic groups most similar to Malaysians are Italian (12.2%, a difference of 0.010%), Samoan (12.2%, a difference of 0.030%), Bahamian (12.2%, a difference of 0.10%), Inupiat (12.2%, a difference of 0.11%), and West Indian (12.2%, a difference of 0.13%).
| Demographics | Rating | Rank | Disability |
| Mexicans | 3.7 /100 | #224 | Tragic 12.1% |
| Senegalese | 3.5 /100 | #225 | Tragic 12.1% |
| Jamaicans | 3.3 /100 | #226 | Tragic 12.1% |
| Alsatians | 3.3 /100 | #227 | Tragic 12.1% |
| West Indians | 2.9 /100 | #228 | Tragic 12.2% |
| Inupiat | 2.8 /100 | #229 | Tragic 12.2% |
| Samoans | 2.6 /100 | #230 | Tragic 12.2% |
| Malaysians | 2.5 /100 | #231 | Tragic 12.2% |
| Italians | 2.5 /100 | #232 | Tragic 12.2% |
| Bahamians | 2.3 /100 | #233 | Tragic 12.2% |
| Japanese | 2.3 /100 | #234 | Tragic 12.2% |
| Yup'ik | 2.2 /100 | #235 | Tragic 12.2% |
| Chinese | 2.0 /100 | #236 | Tragic 12.2% |
| Immigrants | Congo | 1.9 /100 | #237 | Tragic 12.2% |
| Norwegians | 1.9 /100 | #238 | Tragic 12.2% |
Demographics Similar to Paiute by Disability
In terms of disability, the demographic groups most similar to Paiute are Apache (13.9%, a difference of 0.13%), Iroquois (13.8%, a difference of 0.42%), American (13.9%, a difference of 0.42%), Menominee (13.8%, a difference of 0.63%), and Pima (13.7%, a difference of 1.2%).
| Demographics | Rating | Rank | Disability |
| Blacks/African Americans | 0.0 /100 | #314 | Tragic 13.7% |
| Puget Sound Salish | 0.0 /100 | #315 | Tragic 13.7% |
| Pima | 0.0 /100 | #316 | Tragic 13.7% |
| Immigrants | Cabo Verde | 0.0 /100 | #317 | Tragic 13.7% |
| Menominee | 0.0 /100 | #318 | Tragic 13.8% |
| Iroquois | 0.0 /100 | #319 | Tragic 13.8% |
| Apache | 0.0 /100 | #320 | Tragic 13.9% |
| Paiute | 0.0 /100 | #321 | Tragic 13.9% |
| Americans | 0.0 /100 | #322 | Tragic 13.9% |
| Comanche | 0.0 /100 | #323 | Tragic 14.1% |
| Chippewa | 0.0 /100 | #324 | Tragic 14.1% |
| Natives/Alaskans | 0.0 /100 | #325 | Tragic 14.2% |
| Osage | 0.0 /100 | #326 | Tragic 14.2% |
| Ottawa | 0.0 /100 | #327 | Tragic 14.2% |
| Immigrants | Azores | 0.0 /100 | #328 | Tragic 14.2% |