Malaysian vs Welsh Disability
COMPARE
Malaysian
Welsh
Disability
Disability Comparison
Malaysians
Welsh
12.2%
DISABILITY
2.5/ 100
METRIC RATING
231st/ 347
METRIC RANK
12.9%
DISABILITY
0.0/ 100
METRIC RATING
284th/ 347
METRIC RANK
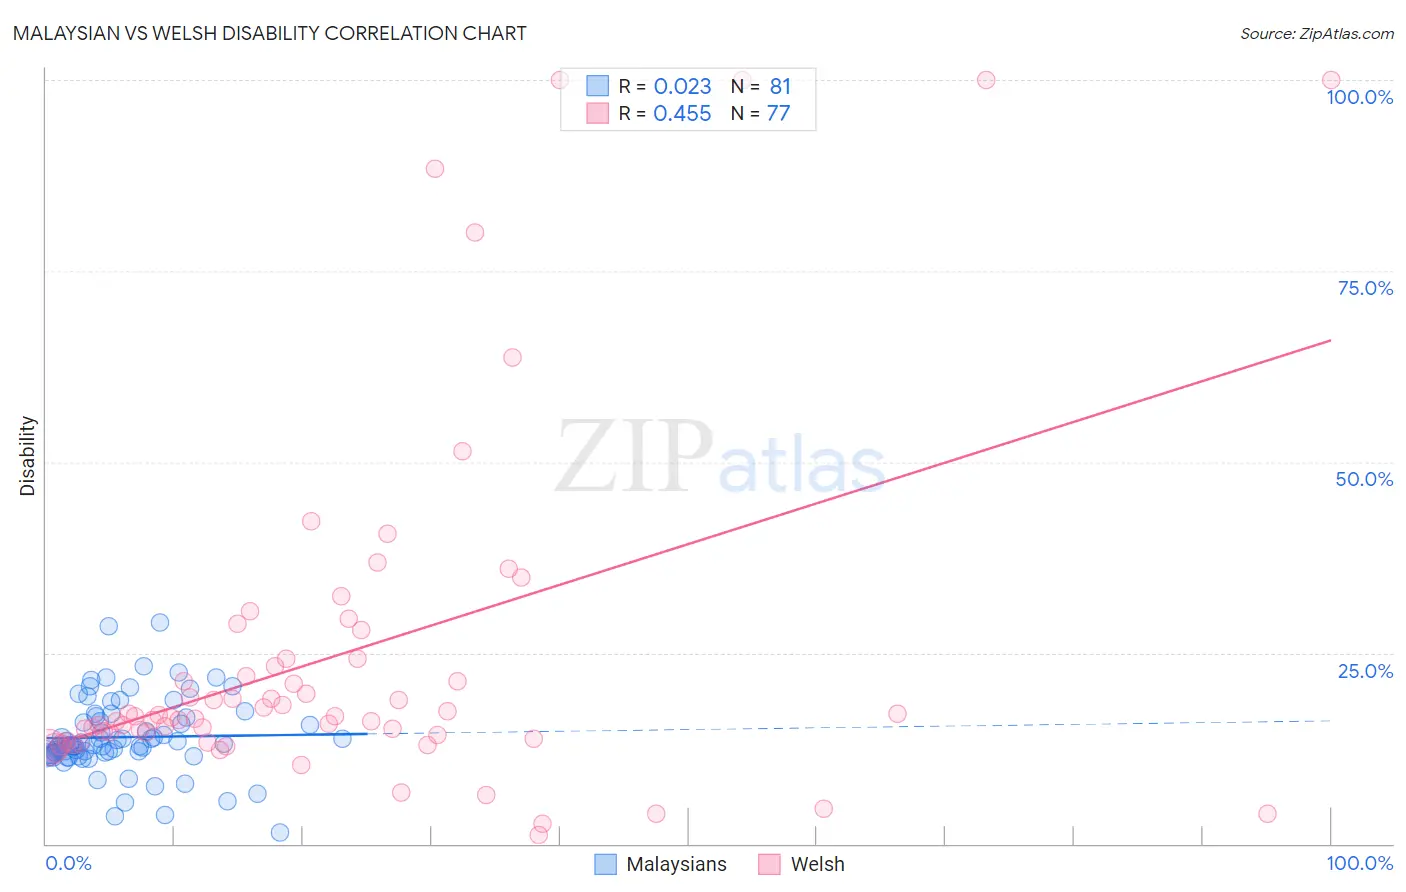
Malaysian vs Welsh Disability Correlation Chart
The statistical analysis conducted on geographies consisting of 226,067,054 people shows no correlation between the proportion of Malaysians and percentage of population with a disability in the United States with a correlation coefficient (R) of 0.023 and weighted average of 12.2%. Similarly, the statistical analysis conducted on geographies consisting of 528,530,777 people shows a moderate positive correlation between the proportion of Welsh and percentage of population with a disability in the United States with a correlation coefficient (R) of 0.455 and weighted average of 12.9%, a difference of 6.0%.
Disability Correlation Summary
| Measurement | Malaysian | Welsh |
| Minimum | 1.5% | 1.2% |
| Maximum | 29.0% | 100.0% |
| Range | 27.5% | 98.8% |
| Mean | 14.0% | 24.8% |
| Median | 12.9% | 16.7% |
| Interquartile 25% (IQ1) | 11.8% | 14.0% |
| Interquartile 75% (IQ3) | 16.6% | 24.2% |
| Interquartile Range (IQR) | 4.9% | 10.1% |
| Standard Deviation (Sample) | 5.0% | 23.0% |
| Standard Deviation (Population) | 4.9% | 22.8% |
Similar Demographics by Disability
Demographics Similar to Malaysians by Disability
In terms of disability, the demographic groups most similar to Malaysians are Italian (12.2%, a difference of 0.010%), Samoan (12.2%, a difference of 0.030%), Bahamian (12.2%, a difference of 0.10%), Inupiat (12.2%, a difference of 0.11%), and West Indian (12.2%, a difference of 0.13%).
| Demographics | Rating | Rank | Disability |
| Mexicans | 3.7 /100 | #224 | Tragic 12.1% |
| Senegalese | 3.5 /100 | #225 | Tragic 12.1% |
| Jamaicans | 3.3 /100 | #226 | Tragic 12.1% |
| Alsatians | 3.3 /100 | #227 | Tragic 12.1% |
| West Indians | 2.9 /100 | #228 | Tragic 12.2% |
| Inupiat | 2.8 /100 | #229 | Tragic 12.2% |
| Samoans | 2.6 /100 | #230 | Tragic 12.2% |
| Malaysians | 2.5 /100 | #231 | Tragic 12.2% |
| Italians | 2.5 /100 | #232 | Tragic 12.2% |
| Bahamians | 2.3 /100 | #233 | Tragic 12.2% |
| Japanese | 2.3 /100 | #234 | Tragic 12.2% |
| Yup'ik | 2.2 /100 | #235 | Tragic 12.2% |
| Chinese | 2.0 /100 | #236 | Tragic 12.2% |
| Immigrants | Congo | 1.9 /100 | #237 | Tragic 12.2% |
| Norwegians | 1.9 /100 | #238 | Tragic 12.2% |
Demographics Similar to Welsh by Disability
In terms of disability, the demographic groups most similar to Welsh are Crow (12.9%, a difference of 0.010%), Irish (12.9%, a difference of 0.19%), Scottish (12.9%, a difference of 0.22%), Immigrants from Portugal (12.9%, a difference of 0.36%), and English (13.0%, a difference of 0.39%).
| Demographics | Rating | Rank | Disability |
| Dutch | 0.0 /100 | #277 | Tragic 12.8% |
| Germans | 0.0 /100 | #278 | Tragic 12.8% |
| Fijians | 0.0 /100 | #279 | Tragic 12.8% |
| Spanish | 0.0 /100 | #280 | Tragic 12.8% |
| Immigrants | Portugal | 0.0 /100 | #281 | Tragic 12.9% |
| Scottish | 0.0 /100 | #282 | Tragic 12.9% |
| Irish | 0.0 /100 | #283 | Tragic 12.9% |
| Welsh | 0.0 /100 | #284 | Tragic 12.9% |
| Crow | 0.0 /100 | #285 | Tragic 12.9% |
| English | 0.0 /100 | #286 | Tragic 13.0% |
| Africans | 0.0 /100 | #287 | Tragic 13.0% |
| Whites/Caucasians | 0.0 /100 | #288 | Tragic 13.0% |
| Slovaks | 0.0 /100 | #289 | Tragic 13.0% |
| Cheyenne | 0.0 /100 | #290 | Tragic 13.0% |
| Yaqui | 0.0 /100 | #291 | Tragic 13.1% |