Malaysian vs Immigrants from Jamaica Disability
COMPARE
Malaysian
Immigrants from Jamaica
Disability
Disability Comparison
Malaysians
Immigrants from Jamaica
12.2%
DISABILITY
2.5/ 100
METRIC RATING
231st/ 347
METRIC RANK
12.1%
DISABILITY
5.0/ 100
METRIC RATING
218th/ 347
METRIC RANK
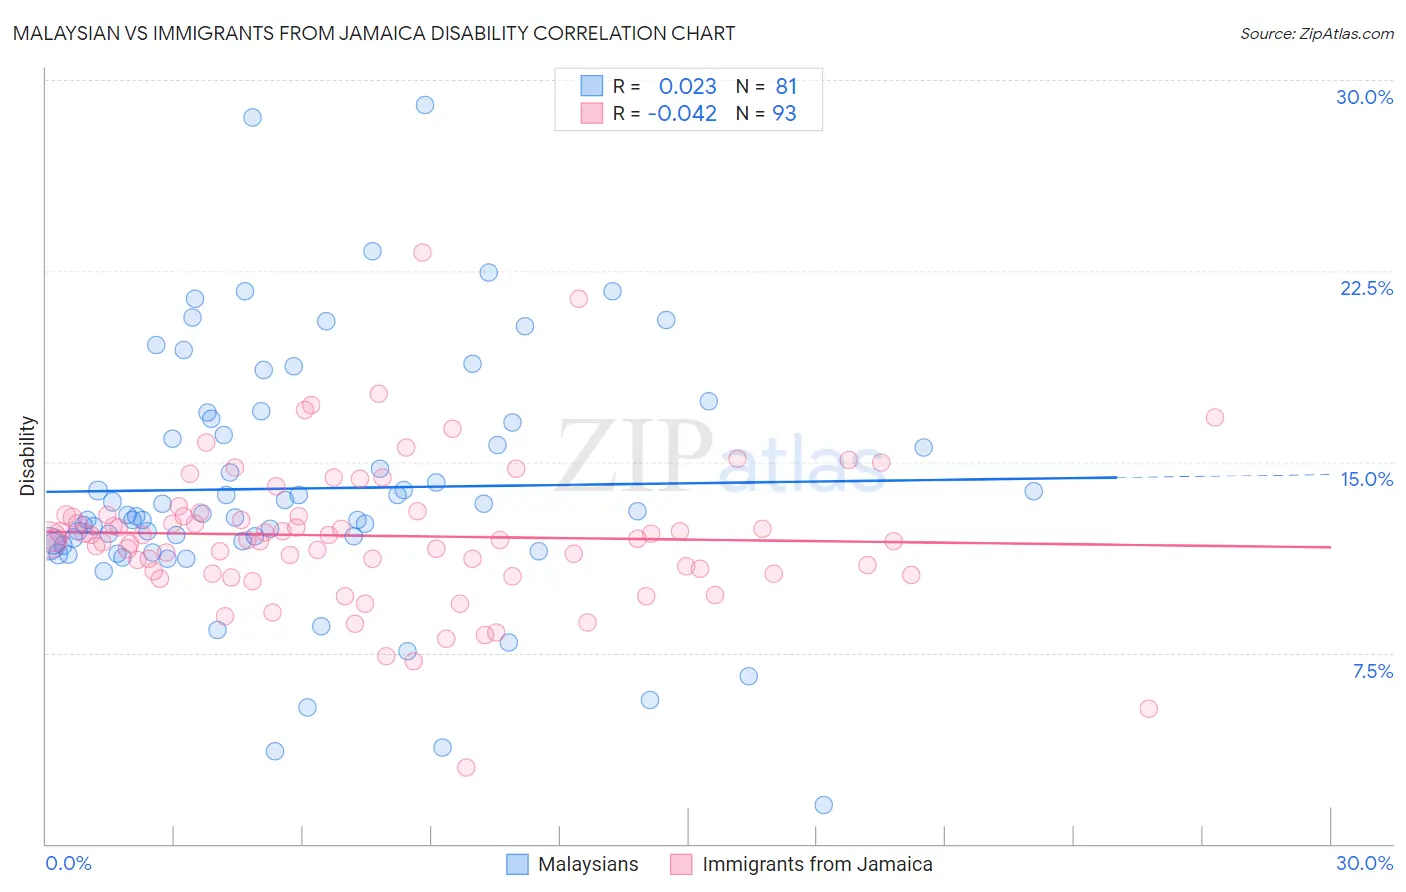
Malaysian vs Immigrants from Jamaica Disability Correlation Chart
The statistical analysis conducted on geographies consisting of 226,067,054 people shows no correlation between the proportion of Malaysians and percentage of population with a disability in the United States with a correlation coefficient (R) of 0.023 and weighted average of 12.2%. Similarly, the statistical analysis conducted on geographies consisting of 301,749,565 people shows no correlation between the proportion of Immigrants from Jamaica and percentage of population with a disability in the United States with a correlation coefficient (R) of -0.042 and weighted average of 12.1%, a difference of 0.76%.
Disability Correlation Summary
| Measurement | Malaysian | Immigrants from Jamaica |
| Minimum | 1.5% | 3.0% |
| Maximum | 29.0% | 23.2% |
| Range | 27.5% | 20.2% |
| Mean | 14.0% | 12.1% |
| Median | 12.9% | 12.0% |
| Interquartile 25% (IQ1) | 11.8% | 10.7% |
| Interquartile 75% (IQ3) | 16.6% | 12.9% |
| Interquartile Range (IQR) | 4.9% | 2.3% |
| Standard Deviation (Sample) | 5.0% | 2.9% |
| Standard Deviation (Population) | 4.9% | 2.9% |
Demographics Similar to Malaysians and Immigrants from Jamaica by Disability
In terms of disability, the demographic groups most similar to Malaysians are Italian (12.2%, a difference of 0.010%), Samoan (12.2%, a difference of 0.030%), Bahamian (12.2%, a difference of 0.10%), Inupiat (12.2%, a difference of 0.11%), and West Indian (12.2%, a difference of 0.13%). Similarly, the demographic groups most similar to Immigrants from Jamaica are Croatian (12.1%, a difference of 0.040%), Immigrants from North America (12.1%, a difference of 0.060%), Panamanian (12.1%, a difference of 0.070%), Immigrants from Bahamas (12.1%, a difference of 0.080%), and Northern European (12.1%, a difference of 0.20%).
| Demographics | Rating | Rank | Disability |
| Immigrants | Somalia | 6.8 /100 | #214 | Tragic 12.0% |
| Immigrants | Canada | 6.1 /100 | #215 | Tragic 12.1% |
| Panamanians | 5.4 /100 | #216 | Tragic 12.1% |
| Immigrants | North America | 5.3 /100 | #217 | Tragic 12.1% |
| Immigrants | Jamaica | 5.0 /100 | #218 | Tragic 12.1% |
| Croatians | 4.9 /100 | #219 | Tragic 12.1% |
| Immigrants | Bahamas | 4.7 /100 | #220 | Tragic 12.1% |
| Northern Europeans | 4.2 /100 | #221 | Tragic 12.1% |
| Spanish American Indians | 4.1 /100 | #222 | Tragic 12.1% |
| Hispanics or Latinos | 3.9 /100 | #223 | Tragic 12.1% |
| Mexicans | 3.7 /100 | #224 | Tragic 12.1% |
| Senegalese | 3.5 /100 | #225 | Tragic 12.1% |
| Jamaicans | 3.3 /100 | #226 | Tragic 12.1% |
| Alsatians | 3.3 /100 | #227 | Tragic 12.1% |
| West Indians | 2.9 /100 | #228 | Tragic 12.2% |
| Inupiat | 2.8 /100 | #229 | Tragic 12.2% |
| Samoans | 2.6 /100 | #230 | Tragic 12.2% |
| Malaysians | 2.5 /100 | #231 | Tragic 12.2% |
| Italians | 2.5 /100 | #232 | Tragic 12.2% |
| Bahamians | 2.3 /100 | #233 | Tragic 12.2% |
| Japanese | 2.3 /100 | #234 | Tragic 12.2% |