Malaysian vs Native Hawaiian Disability
COMPARE
Malaysian
Native Hawaiian
Disability
Disability Comparison
Malaysians
Native Hawaiians
12.2%
DISABILITY
2.5/ 100
METRIC RATING
231st/ 347
METRIC RANK
12.5%
DISABILITY
0.3/ 100
METRIC RATING
262nd/ 347
METRIC RANK
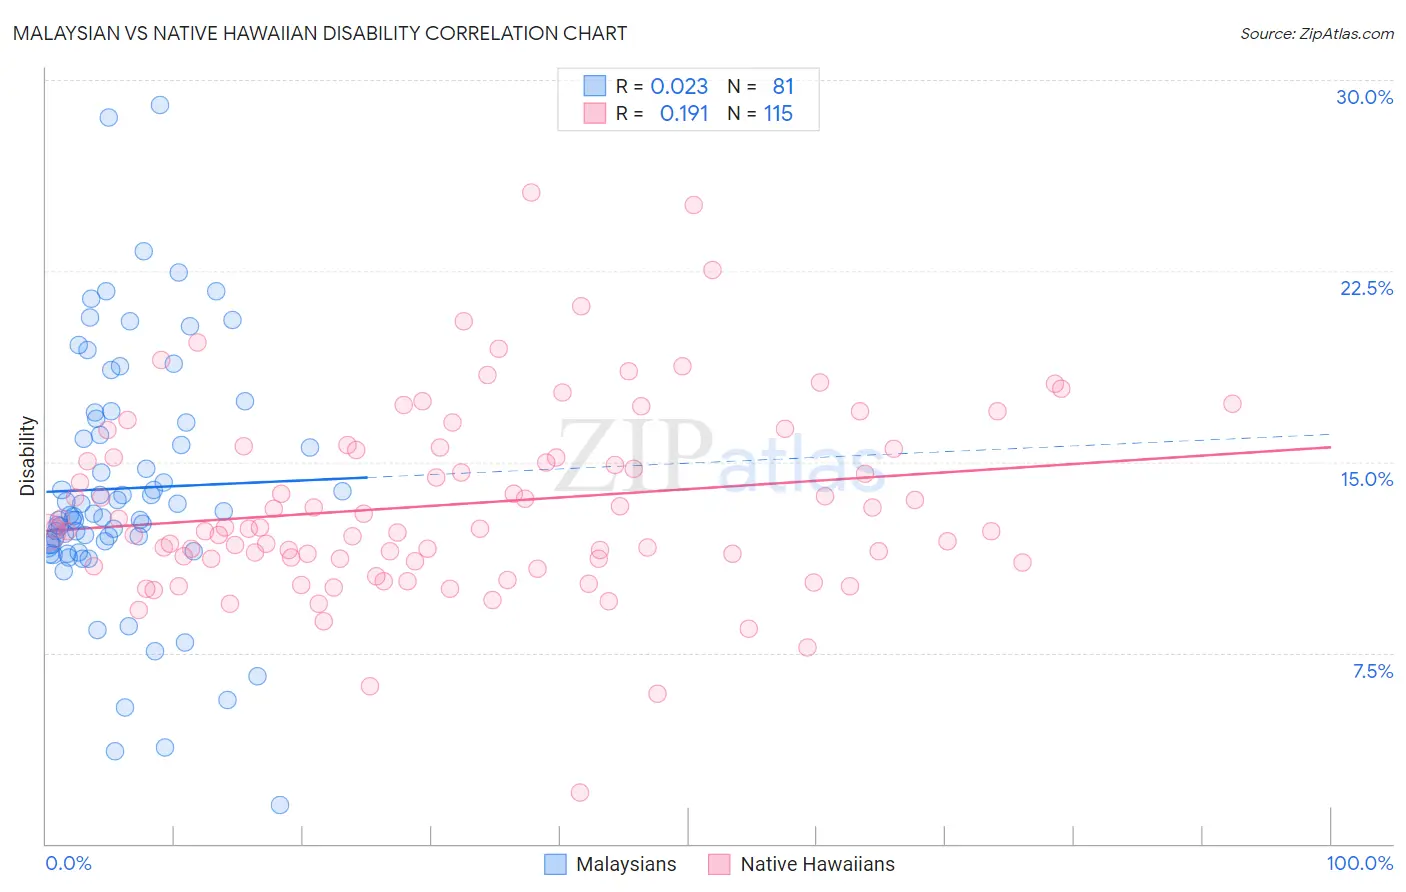
Malaysian vs Native Hawaiian Disability Correlation Chart
The statistical analysis conducted on geographies consisting of 226,067,054 people shows no correlation between the proportion of Malaysians and percentage of population with a disability in the United States with a correlation coefficient (R) of 0.023 and weighted average of 12.2%. Similarly, the statistical analysis conducted on geographies consisting of 332,036,989 people shows a poor positive correlation between the proportion of Native Hawaiians and percentage of population with a disability in the United States with a correlation coefficient (R) of 0.191 and weighted average of 12.5%, a difference of 2.3%.
Disability Correlation Summary
| Measurement | Malaysian | Native Hawaiian |
| Minimum | 1.5% | 2.0% |
| Maximum | 29.0% | 25.6% |
| Range | 27.5% | 23.6% |
| Mean | 14.0% | 13.3% |
| Median | 12.9% | 12.4% |
| Interquartile 25% (IQ1) | 11.8% | 11.2% |
| Interquartile 75% (IQ3) | 16.6% | 15.5% |
| Interquartile Range (IQR) | 4.9% | 4.4% |
| Standard Deviation (Sample) | 5.0% | 3.7% |
| Standard Deviation (Population) | 4.9% | 3.7% |
Similar Demographics by Disability
Demographics Similar to Malaysians by Disability
In terms of disability, the demographic groups most similar to Malaysians are Italian (12.2%, a difference of 0.010%), Samoan (12.2%, a difference of 0.030%), Bahamian (12.2%, a difference of 0.10%), Inupiat (12.2%, a difference of 0.11%), and West Indian (12.2%, a difference of 0.13%).
| Demographics | Rating | Rank | Disability |
| Mexicans | 3.7 /100 | #224 | Tragic 12.1% |
| Senegalese | 3.5 /100 | #225 | Tragic 12.1% |
| Jamaicans | 3.3 /100 | #226 | Tragic 12.1% |
| Alsatians | 3.3 /100 | #227 | Tragic 12.1% |
| West Indians | 2.9 /100 | #228 | Tragic 12.2% |
| Inupiat | 2.8 /100 | #229 | Tragic 12.2% |
| Samoans | 2.6 /100 | #230 | Tragic 12.2% |
| Malaysians | 2.5 /100 | #231 | Tragic 12.2% |
| Italians | 2.5 /100 | #232 | Tragic 12.2% |
| Bahamians | 2.3 /100 | #233 | Tragic 12.2% |
| Japanese | 2.3 /100 | #234 | Tragic 12.2% |
| Yup'ik | 2.2 /100 | #235 | Tragic 12.2% |
| Chinese | 2.0 /100 | #236 | Tragic 12.2% |
| Immigrants | Congo | 1.9 /100 | #237 | Tragic 12.2% |
| Norwegians | 1.9 /100 | #238 | Tragic 12.2% |
Demographics Similar to Native Hawaiians by Disability
In terms of disability, the demographic groups most similar to Native Hawaiians are Hawaiian (12.5%, a difference of 0.20%), Scandinavian (12.4%, a difference of 0.27%), Immigrants from Germany (12.5%, a difference of 0.32%), U.S. Virgin Islander (12.5%, a difference of 0.33%), and Immigrants from Liberia (12.4%, a difference of 0.34%).
| Demographics | Rating | Rank | Disability |
| Slovenes | 0.6 /100 | #255 | Tragic 12.4% |
| Immigrants | Dominica | 0.6 /100 | #256 | Tragic 12.4% |
| Immigrants | Laos | 0.5 /100 | #257 | Tragic 12.4% |
| Slavs | 0.5 /100 | #258 | Tragic 12.4% |
| Canadians | 0.4 /100 | #259 | Tragic 12.4% |
| Immigrants | Liberia | 0.4 /100 | #260 | Tragic 12.4% |
| Scandinavians | 0.4 /100 | #261 | Tragic 12.4% |
| Native Hawaiians | 0.3 /100 | #262 | Tragic 12.5% |
| Hawaiians | 0.2 /100 | #263 | Tragic 12.5% |
| Immigrants | Germany | 0.2 /100 | #264 | Tragic 12.5% |
| U.S. Virgin Islanders | 0.2 /100 | #265 | Tragic 12.5% |
| Czechoslovakians | 0.2 /100 | #266 | Tragic 12.5% |
| Spaniards | 0.2 /100 | #267 | Tragic 12.5% |
| Bangladeshis | 0.1 /100 | #268 | Tragic 12.6% |
| Immigrants | Dominican Republic | 0.1 /100 | #269 | Tragic 12.6% |