Malaysian vs Immigrants from Kuwait Disability
COMPARE
Malaysian
Immigrants from Kuwait
Disability
Disability Comparison
Malaysians
Immigrants from Kuwait
12.2%
DISABILITY
2.5/ 100
METRIC RATING
231st/ 347
METRIC RANK
10.7%
DISABILITY
100.0/ 100
METRIC RATING
33rd/ 347
METRIC RANK
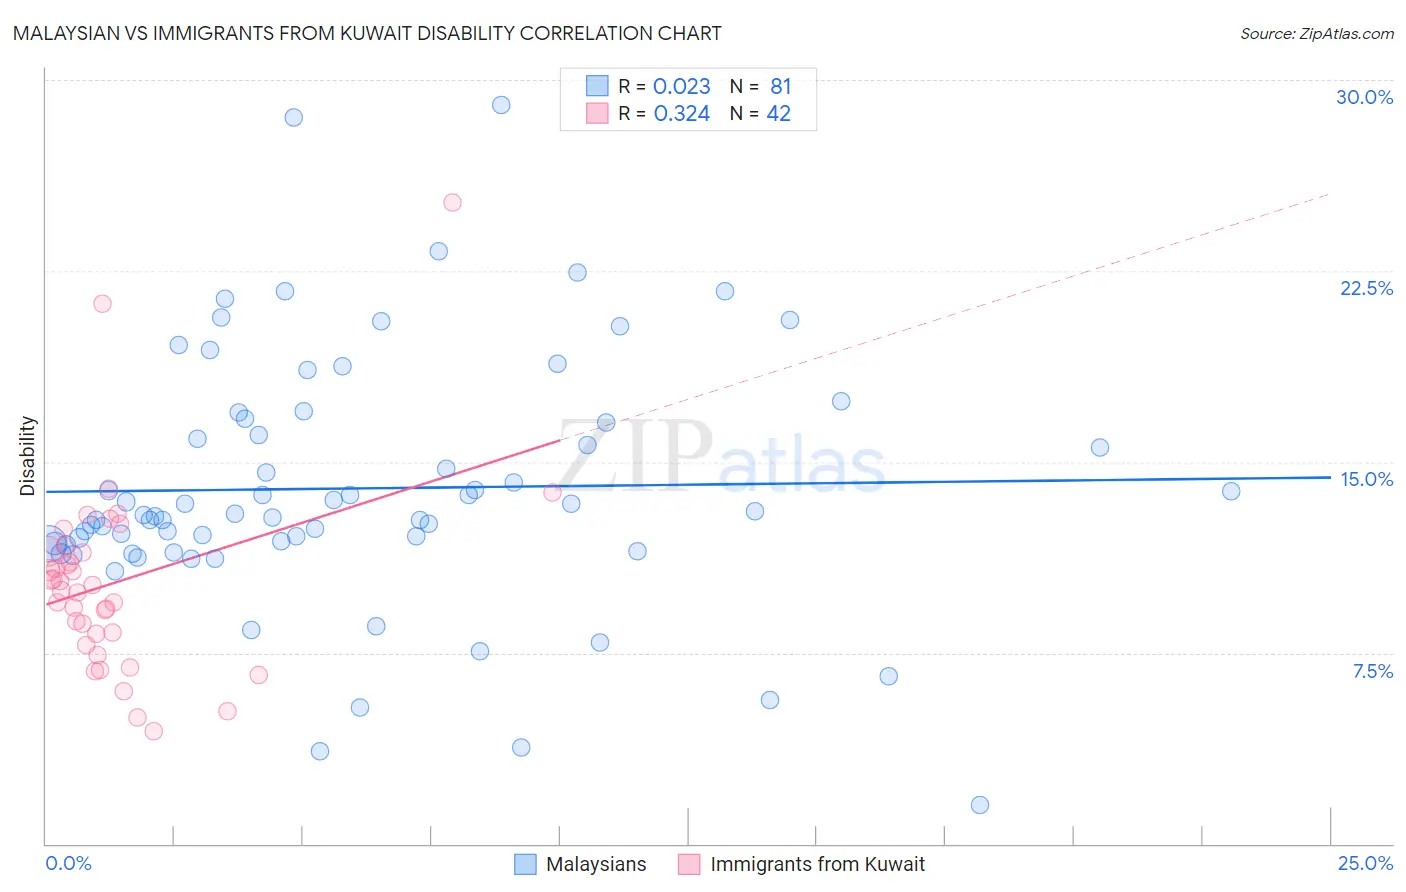
Malaysian vs Immigrants from Kuwait Disability Correlation Chart
The statistical analysis conducted on geographies consisting of 226,067,054 people shows no correlation between the proportion of Malaysians and percentage of population with a disability in the United States with a correlation coefficient (R) of 0.023 and weighted average of 12.2%. Similarly, the statistical analysis conducted on geographies consisting of 136,916,630 people shows a mild positive correlation between the proportion of Immigrants from Kuwait and percentage of population with a disability in the United States with a correlation coefficient (R) of 0.324 and weighted average of 10.7%, a difference of 14.0%.
Disability Correlation Summary
| Measurement | Malaysian | Immigrants from Kuwait |
| Minimum | 1.5% | 4.4% |
| Maximum | 29.0% | 25.2% |
| Range | 27.5% | 20.8% |
| Mean | 14.0% | 10.3% |
| Median | 12.9% | 10.0% |
| Interquartile 25% (IQ1) | 11.8% | 8.3% |
| Interquartile 75% (IQ3) | 16.6% | 11.5% |
| Interquartile Range (IQR) | 4.9% | 3.2% |
| Standard Deviation (Sample) | 5.0% | 3.8% |
| Standard Deviation (Population) | 4.9% | 3.8% |
Similar Demographics by Disability
Demographics Similar to Malaysians by Disability
In terms of disability, the demographic groups most similar to Malaysians are Italian (12.2%, a difference of 0.010%), Samoan (12.2%, a difference of 0.030%), Bahamian (12.2%, a difference of 0.10%), Inupiat (12.2%, a difference of 0.11%), and West Indian (12.2%, a difference of 0.13%).
| Demographics | Rating | Rank | Disability |
| Mexicans | 3.7 /100 | #224 | Tragic 12.1% |
| Senegalese | 3.5 /100 | #225 | Tragic 12.1% |
| Jamaicans | 3.3 /100 | #226 | Tragic 12.1% |
| Alsatians | 3.3 /100 | #227 | Tragic 12.1% |
| West Indians | 2.9 /100 | #228 | Tragic 12.2% |
| Inupiat | 2.8 /100 | #229 | Tragic 12.2% |
| Samoans | 2.6 /100 | #230 | Tragic 12.2% |
| Malaysians | 2.5 /100 | #231 | Tragic 12.2% |
| Italians | 2.5 /100 | #232 | Tragic 12.2% |
| Bahamians | 2.3 /100 | #233 | Tragic 12.2% |
| Japanese | 2.3 /100 | #234 | Tragic 12.2% |
| Yup'ik | 2.2 /100 | #235 | Tragic 12.2% |
| Chinese | 2.0 /100 | #236 | Tragic 12.2% |
| Immigrants | Congo | 1.9 /100 | #237 | Tragic 12.2% |
| Norwegians | 1.9 /100 | #238 | Tragic 12.2% |
Demographics Similar to Immigrants from Kuwait by Disability
In terms of disability, the demographic groups most similar to Immigrants from Kuwait are Immigrants from Ethiopia (10.7%, a difference of 0.22%), Immigrants from Indonesia (10.7%, a difference of 0.23%), Paraguayan (10.6%, a difference of 0.25%), Ethiopian (10.7%, a difference of 0.29%), and Turkish (10.7%, a difference of 0.30%).
| Demographics | Rating | Rank | Disability |
| Argentineans | 100.0 /100 | #26 | Exceptional 10.6% |
| Cypriots | 100.0 /100 | #27 | Exceptional 10.6% |
| Egyptians | 100.0 /100 | #28 | Exceptional 10.6% |
| Immigrants | Argentina | 100.0 /100 | #29 | Exceptional 10.6% |
| Immigrants | Turkey | 100.0 /100 | #30 | Exceptional 10.6% |
| Immigrants | Egypt | 100.0 /100 | #31 | Exceptional 10.6% |
| Paraguayans | 100.0 /100 | #32 | Exceptional 10.6% |
| Immigrants | Kuwait | 100.0 /100 | #33 | Exceptional 10.7% |
| Immigrants | Ethiopia | 100.0 /100 | #34 | Exceptional 10.7% |
| Immigrants | Indonesia | 100.0 /100 | #35 | Exceptional 10.7% |
| Ethiopians | 100.0 /100 | #36 | Exceptional 10.7% |
| Turks | 100.0 /100 | #37 | Exceptional 10.7% |
| Afghans | 99.9 /100 | #38 | Exceptional 10.8% |
| Cambodians | 99.9 /100 | #39 | Exceptional 10.8% |
| Mongolians | 99.9 /100 | #40 | Exceptional 10.8% |