Irish vs Immigrants from North America Disability
COMPARE
Irish
Immigrants from North America
Disability
Disability Comparison
Irish
Immigrants from North America
12.9%
DISABILITY
0.0/ 100
METRIC RATING
283rd/ 347
METRIC RANK
12.1%
DISABILITY
5.3/ 100
METRIC RATING
217th/ 347
METRIC RANK
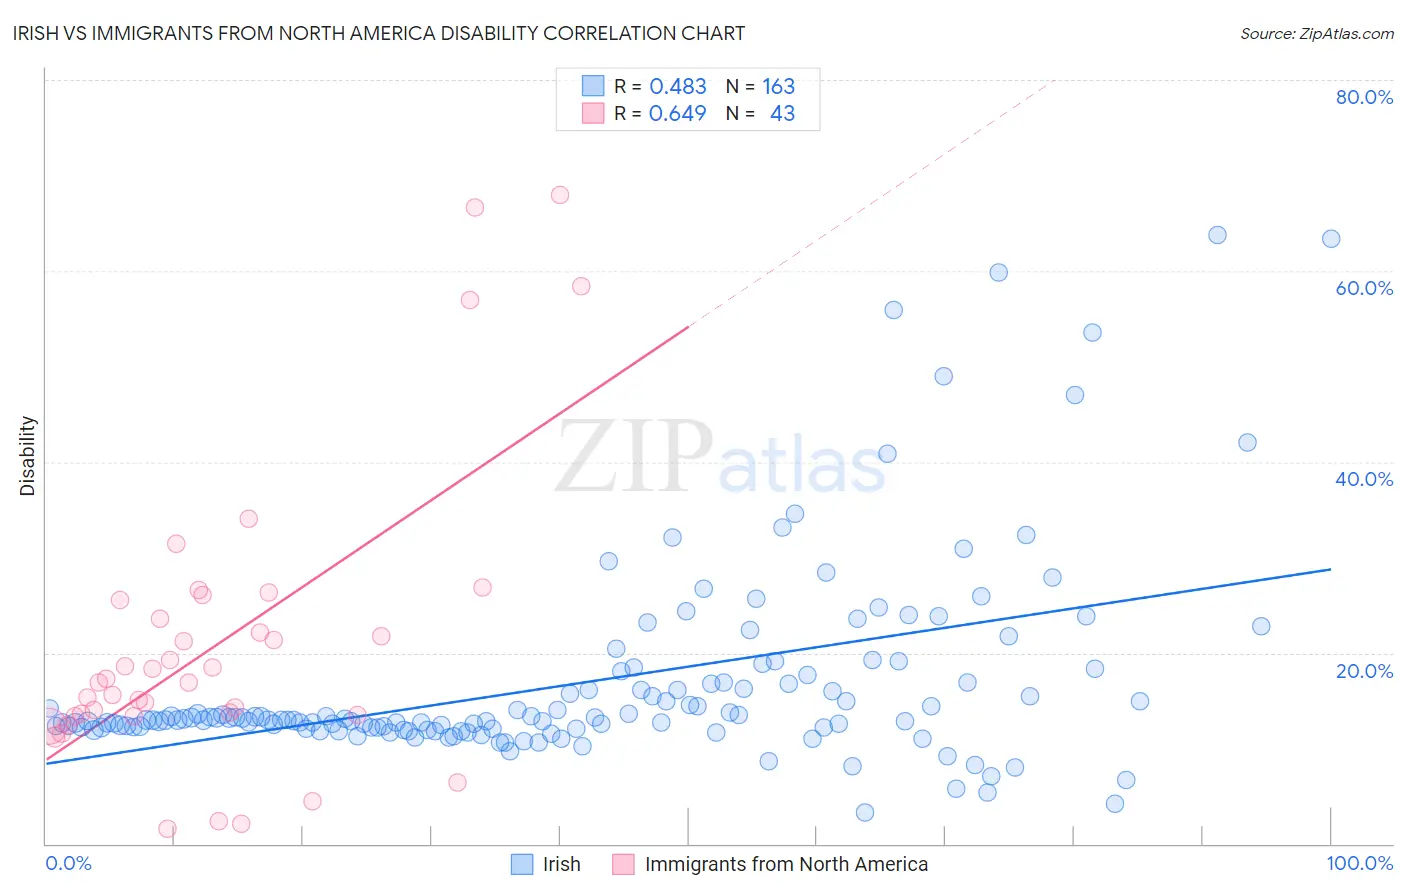
Irish vs Immigrants from North America Disability Correlation Chart
The statistical analysis conducted on geographies consisting of 580,478,993 people shows a moderate positive correlation between the proportion of Irish and percentage of population with a disability in the United States with a correlation coefficient (R) of 0.483 and weighted average of 12.9%. Similarly, the statistical analysis conducted on geographies consisting of 462,438,985 people shows a significant positive correlation between the proportion of Immigrants from North America and percentage of population with a disability in the United States with a correlation coefficient (R) of 0.649 and weighted average of 12.1%, a difference of 6.7%.
Disability Correlation Summary
| Measurement | Irish | Immigrants from North America |
| Minimum | 3.2% | 1.6% |
| Maximum | 63.7% | 68.0% |
| Range | 60.5% | 66.4% |
| Mean | 16.8% | 21.0% |
| Median | 13.0% | 16.9% |
| Interquartile 25% (IQ1) | 12.2% | 13.3% |
| Interquartile 75% (IQ3) | 16.9% | 25.6% |
| Interquartile Range (IQR) | 4.7% | 12.2% |
| Standard Deviation (Sample) | 10.5% | 15.3% |
| Standard Deviation (Population) | 10.4% | 15.2% |
Similar Demographics by Disability
Demographics Similar to Irish by Disability
In terms of disability, the demographic groups most similar to Irish are Scottish (12.9%, a difference of 0.020%), Immigrants from Portugal (12.9%, a difference of 0.16%), Welsh (12.9%, a difference of 0.19%), Crow (12.9%, a difference of 0.20%), and Spanish (12.8%, a difference of 0.30%).
| Demographics | Rating | Rank | Disability |
| Hmong | 0.0 /100 | #276 | Tragic 12.8% |
| Dutch | 0.0 /100 | #277 | Tragic 12.8% |
| Germans | 0.0 /100 | #278 | Tragic 12.8% |
| Fijians | 0.0 /100 | #279 | Tragic 12.8% |
| Spanish | 0.0 /100 | #280 | Tragic 12.8% |
| Immigrants | Portugal | 0.0 /100 | #281 | Tragic 12.9% |
| Scottish | 0.0 /100 | #282 | Tragic 12.9% |
| Irish | 0.0 /100 | #283 | Tragic 12.9% |
| Welsh | 0.0 /100 | #284 | Tragic 12.9% |
| Crow | 0.0 /100 | #285 | Tragic 12.9% |
| English | 0.0 /100 | #286 | Tragic 13.0% |
| Africans | 0.0 /100 | #287 | Tragic 13.0% |
| Whites/Caucasians | 0.0 /100 | #288 | Tragic 13.0% |
| Slovaks | 0.0 /100 | #289 | Tragic 13.0% |
| Cheyenne | 0.0 /100 | #290 | Tragic 13.0% |
Demographics Similar to Immigrants from North America by Disability
In terms of disability, the demographic groups most similar to Immigrants from North America are Panamanian (12.1%, a difference of 0.010%), Immigrants from Jamaica (12.1%, a difference of 0.060%), Croatian (12.1%, a difference of 0.11%), Immigrants from Bahamas (12.1%, a difference of 0.15%), and Immigrants from Canada (12.1%, a difference of 0.16%).
| Demographics | Rating | Rank | Disability |
| Czechs | 7.9 /100 | #210 | Tragic 12.0% |
| Immigrants | Cambodia | 7.3 /100 | #211 | Tragic 12.0% |
| Austrians | 7.2 /100 | #212 | Tragic 12.0% |
| Immigrants | Iraq | 7.1 /100 | #213 | Tragic 12.0% |
| Immigrants | Somalia | 6.8 /100 | #214 | Tragic 12.0% |
| Immigrants | Canada | 6.1 /100 | #215 | Tragic 12.1% |
| Panamanians | 5.4 /100 | #216 | Tragic 12.1% |
| Immigrants | North America | 5.3 /100 | #217 | Tragic 12.1% |
| Immigrants | Jamaica | 5.0 /100 | #218 | Tragic 12.1% |
| Croatians | 4.9 /100 | #219 | Tragic 12.1% |
| Immigrants | Bahamas | 4.7 /100 | #220 | Tragic 12.1% |
| Northern Europeans | 4.2 /100 | #221 | Tragic 12.1% |
| Spanish American Indians | 4.1 /100 | #222 | Tragic 12.1% |
| Hispanics or Latinos | 3.9 /100 | #223 | Tragic 12.1% |
| Mexicans | 3.7 /100 | #224 | Tragic 12.1% |