Irish vs Honduran Disability
COMPARE
Irish
Honduran
Disability
Disability Comparison
Irish
Hondurans
12.9%
DISABILITY
0.0/ 100
METRIC RATING
283rd/ 347
METRIC RANK
11.8%
DISABILITY
31.2/ 100
METRIC RATING
183rd/ 347
METRIC RANK
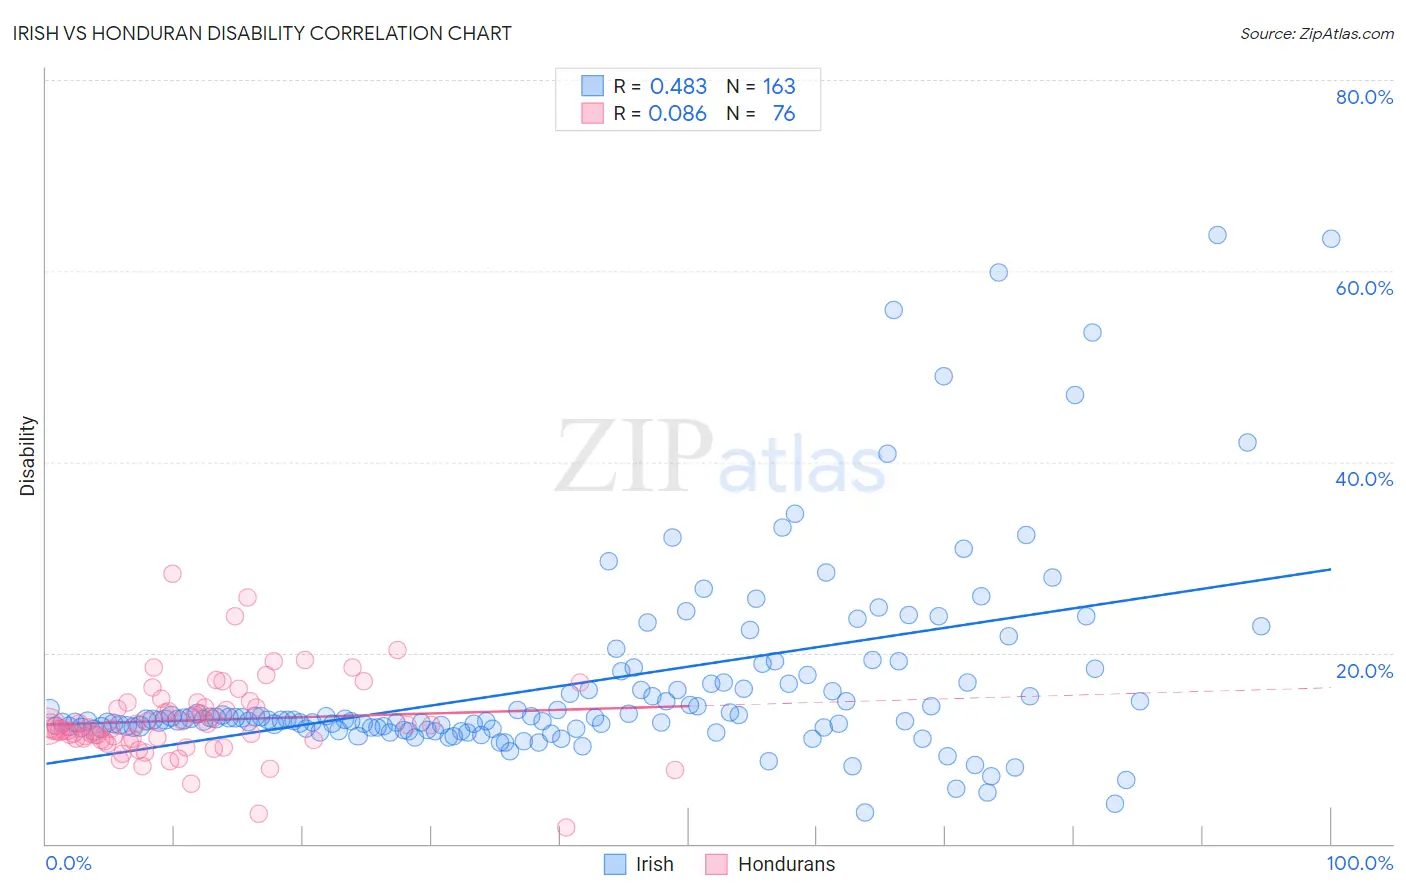
Irish vs Honduran Disability Correlation Chart
The statistical analysis conducted on geographies consisting of 580,478,993 people shows a moderate positive correlation between the proportion of Irish and percentage of population with a disability in the United States with a correlation coefficient (R) of 0.483 and weighted average of 12.9%. Similarly, the statistical analysis conducted on geographies consisting of 357,777,033 people shows a slight positive correlation between the proportion of Hondurans and percentage of population with a disability in the United States with a correlation coefficient (R) of 0.086 and weighted average of 11.8%, a difference of 9.1%.
Disability Correlation Summary
| Measurement | Irish | Honduran |
| Minimum | 3.2% | 1.7% |
| Maximum | 63.7% | 28.3% |
| Range | 60.5% | 26.6% |
| Mean | 16.8% | 12.9% |
| Median | 13.0% | 12.1% |
| Interquartile 25% (IQ1) | 12.2% | 10.9% |
| Interquartile 75% (IQ3) | 16.9% | 14.6% |
| Interquartile Range (IQR) | 4.7% | 3.7% |
| Standard Deviation (Sample) | 10.5% | 4.3% |
| Standard Deviation (Population) | 10.4% | 4.2% |
Similar Demographics by Disability
Demographics Similar to Irish by Disability
In terms of disability, the demographic groups most similar to Irish are Scottish (12.9%, a difference of 0.020%), Immigrants from Portugal (12.9%, a difference of 0.16%), Welsh (12.9%, a difference of 0.19%), Crow (12.9%, a difference of 0.20%), and Spanish (12.8%, a difference of 0.30%).
| Demographics | Rating | Rank | Disability |
| Hmong | 0.0 /100 | #276 | Tragic 12.8% |
| Dutch | 0.0 /100 | #277 | Tragic 12.8% |
| Germans | 0.0 /100 | #278 | Tragic 12.8% |
| Fijians | 0.0 /100 | #279 | Tragic 12.8% |
| Spanish | 0.0 /100 | #280 | Tragic 12.8% |
| Immigrants | Portugal | 0.0 /100 | #281 | Tragic 12.9% |
| Scottish | 0.0 /100 | #282 | Tragic 12.9% |
| Irish | 0.0 /100 | #283 | Tragic 12.9% |
| Welsh | 0.0 /100 | #284 | Tragic 12.9% |
| Crow | 0.0 /100 | #285 | Tragic 12.9% |
| English | 0.0 /100 | #286 | Tragic 13.0% |
| Africans | 0.0 /100 | #287 | Tragic 13.0% |
| Whites/Caucasians | 0.0 /100 | #288 | Tragic 13.0% |
| Slovaks | 0.0 /100 | #289 | Tragic 13.0% |
| Cheyenne | 0.0 /100 | #290 | Tragic 13.0% |
Demographics Similar to Hondurans by Disability
In terms of disability, the demographic groups most similar to Hondurans are Iraqi (11.8%, a difference of 0.060%), Icelander (11.8%, a difference of 0.14%), Immigrants from Burma/Myanmar (11.8%, a difference of 0.14%), Immigrants from Oceania (11.8%, a difference of 0.15%), and Immigrants from Scotland (11.8%, a difference of 0.16%).
| Demographics | Rating | Rank | Disability |
| Immigrants | Western Africa | 47.5 /100 | #176 | Average 11.7% |
| Immigrants | Central America | 46.6 /100 | #177 | Average 11.7% |
| Greeks | 46.2 /100 | #178 | Average 11.7% |
| Immigrants | Armenia | 41.9 /100 | #179 | Average 11.7% |
| Immigrants | Honduras | 37.8 /100 | #180 | Fair 11.8% |
| Immigrants | Oceania | 34.3 /100 | #181 | Fair 11.8% |
| Icelanders | 34.0 /100 | #182 | Fair 11.8% |
| Hondurans | 31.2 /100 | #183 | Fair 11.8% |
| Iraqis | 30.0 /100 | #184 | Fair 11.8% |
| Immigrants | Burma/Myanmar | 28.5 /100 | #185 | Fair 11.8% |
| Immigrants | Scotland | 28.2 /100 | #186 | Fair 11.8% |
| Lebanese | 27.9 /100 | #187 | Fair 11.8% |
| Immigrants | Mexico | 23.8 /100 | #188 | Fair 11.9% |
| Immigrants | Zaire | 21.8 /100 | #189 | Fair 11.9% |
| Immigrants | West Indies | 21.1 /100 | #190 | Fair 11.9% |